Analyze: Turning contextualized data into actionable real-time intelligence
Connecting your systems makes data available. Contextualizing it makes that data understandable and trustworthy. The next step is to use it to continuously evaluate what is happening across your operations.
This is the purpose of the Analyze stage: to transform contextualized operational data into trusted metrics, detected patterns, and decision-ready insights.
In the third post of this architecture series, we move from the Connect and Contextualize stages into Analyze. The objective is not simply to produce more dashboards or reports. It is to create an analytical layer that continuously interprets operational events and states, applies standardized calculations, identifies meaningful changes, and publishes the resulting intelligence back into your operational architecture.
Your analytics should help people understand what is happening, why it is happening, and where attention is required. They should also make the same intelligence available to applications and AI agents that may be responsible for investigating or acting on it.
Adopt real-time & continuous intelligence generation
Traditional manufacturing analytics often relies on periodic extraction, offline processing and retrospective reporting.
This may be sufficient for monthly performance reviews or long-term improvement studies, but it is less effective when your teams need to respond to a developing operational or quality condition.
A metric calculated at the end of a shift may explain what happened but it may not help you intervene while the condition is still developing.
Your Analyze architecture should therefore continuously evaluate operational data.
For example, instead of calculating line performance only after production ends, you may calculate it over a rolling five-minute window. The calculation can be refreshed whenever new production events, equipment states or quality signals arrive.
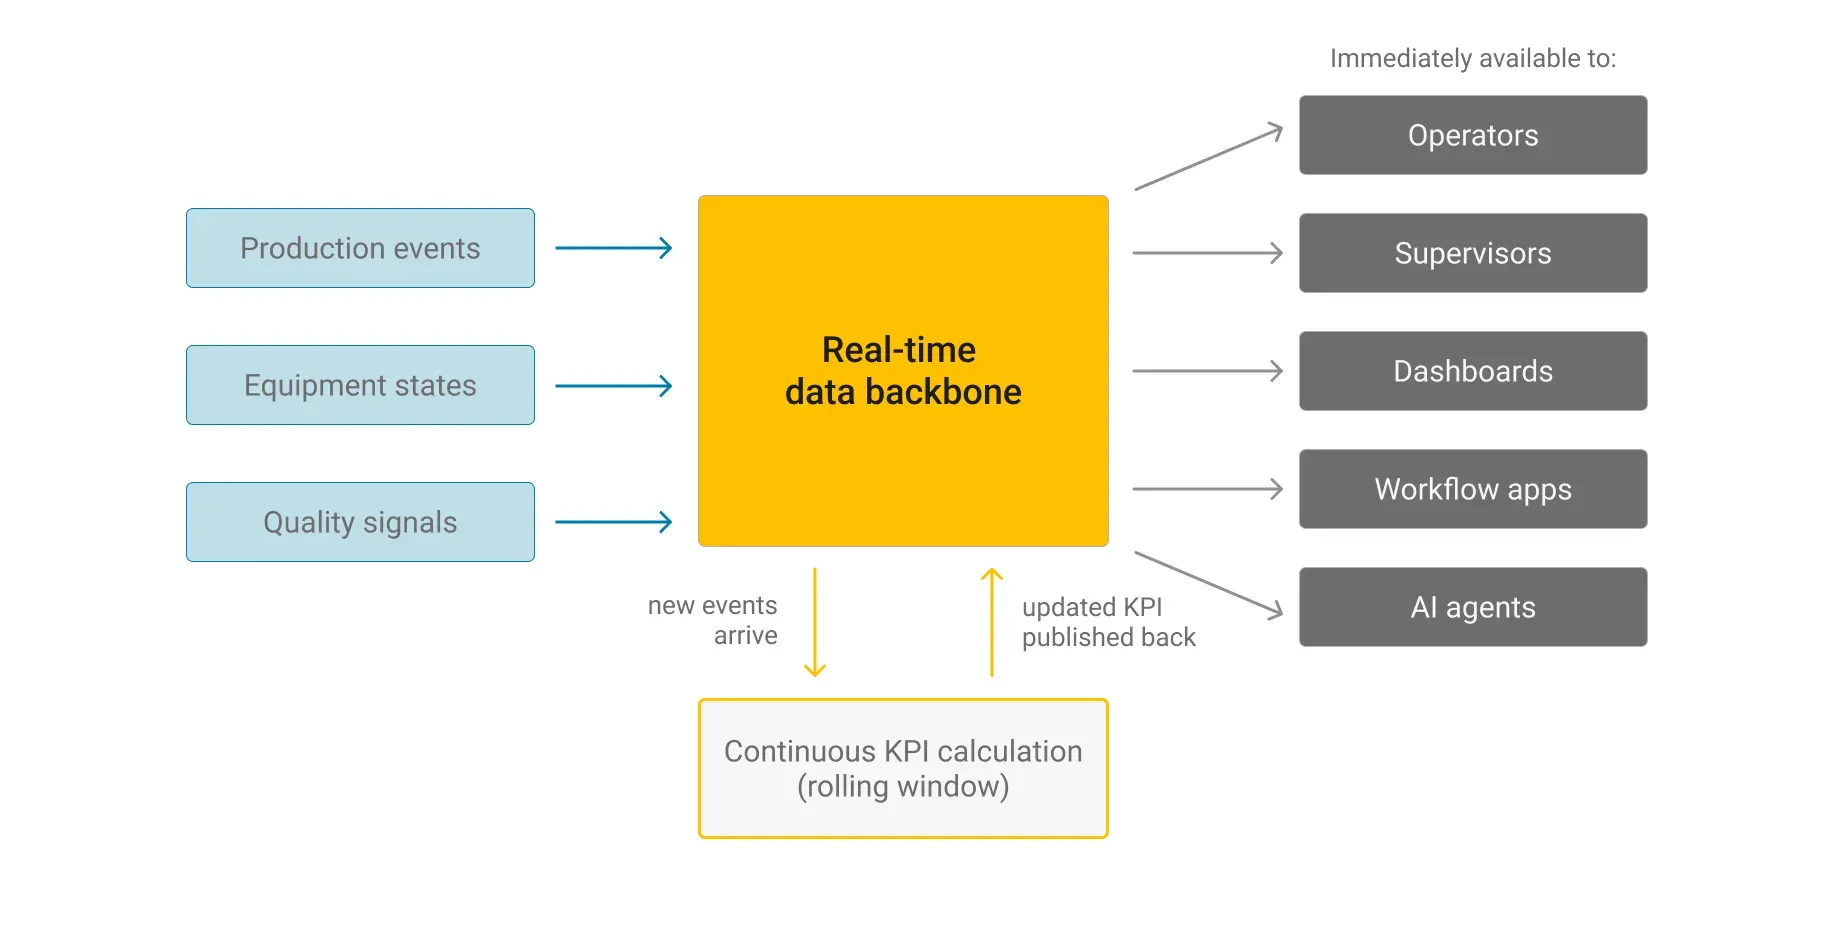 The updated KPI can then be published back into the real-time data backbone, where it becomes immediately available to operators, supervisors, dashboards, workflow applications and AI agents.
This turns analytics from a separate reporting activity into an active part of your operational environment.
Standardize the meaning of your metrics
A KPI is only useful at enterprise scale when it means the same thing wherever it is used.
Different sites often calculate performance, quality, downtime, yield or throughput using different formulas, source systems, exclusions and time windows. Two factories may report the same KPI name while measuring different operational realities.
This makes comparison unreliable and weakens trust in enterprise reporting.
You should therefore define analytical metrics as governed information products.
For each metric, you should establish its purpose, formula, required inputs, source systems, calculation frequency, time window, exclusions, quality rules, ownership and version.
For example, a rolling line-performance KPI should define whether it is based on planned production time, scheduled time, actual runtime, accepted output, total output or some combination of these measures. It should also define how planned stops, quality holds, missing data and incomplete production records are handled.
Once the definition is agreed, the same calculation should be applied consistently across relevant lines and sites.
This enables your teams to compare performance with confidence and gives AI agents a stable basis for interpreting the metric.
Analyze events in operational context
Raw values rarely provide enough information to support a decision.
A reduction in throughput may be caused by an equipment constraint, a material issue, a process change, a quality hold, an upstream delay or a planned operating condition.
Your analytical services should therefore use the context established in the previous stage.
A calculation should be able to relate measurements and events to the relevant asset, production order, batch, material, process phase, shift and quality status.
In a life-sciences production scenario, for example, a decrease in batch progression may appear to be a performance problem. However, the process may be intentionally held while awaiting an approved laboratory result. Without this context, an analytical service could classify normal process behavior as a deviation.
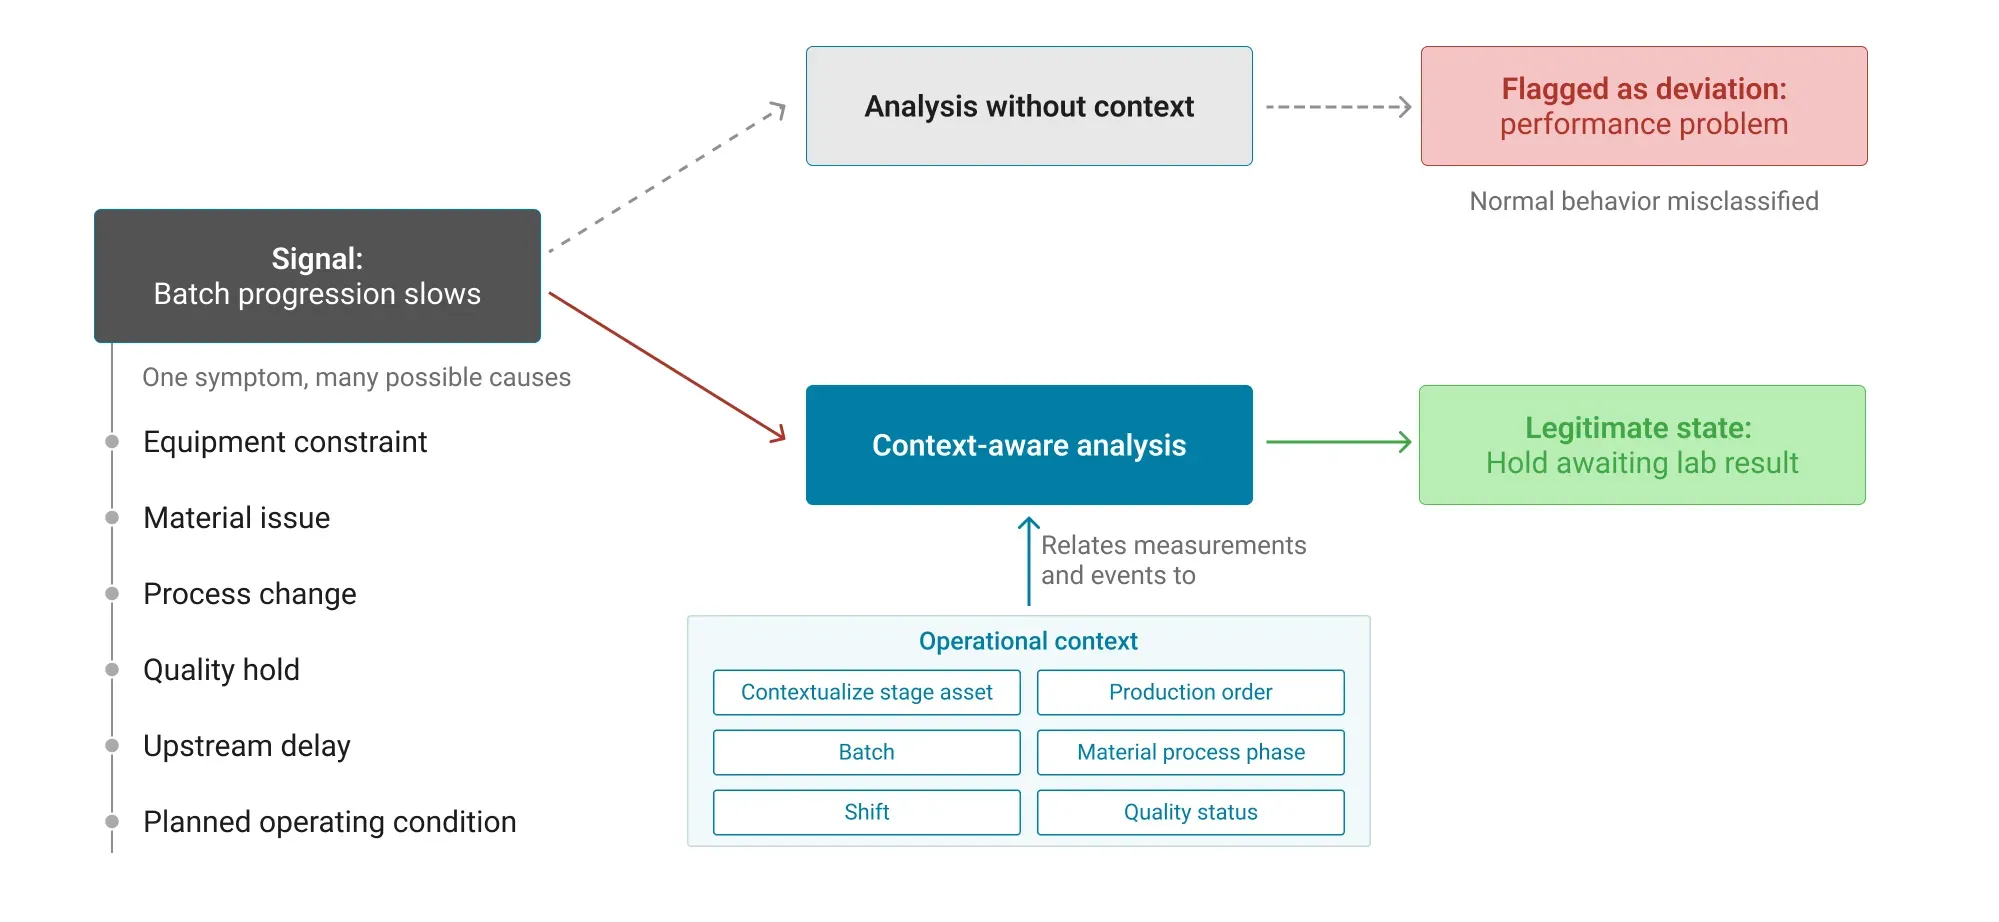 Context allows you to distinguish between an abnormal condition and a legitimate operational state.
It also allows the same signal to be interpreted differently depending on where it occurs in the process. For organizations building this foundation, a Unified Namespace can provide a structured approach to making industrial data available with shared meaning across OT and IT systems.
Build reusable analytical services that creates trusted intelligence
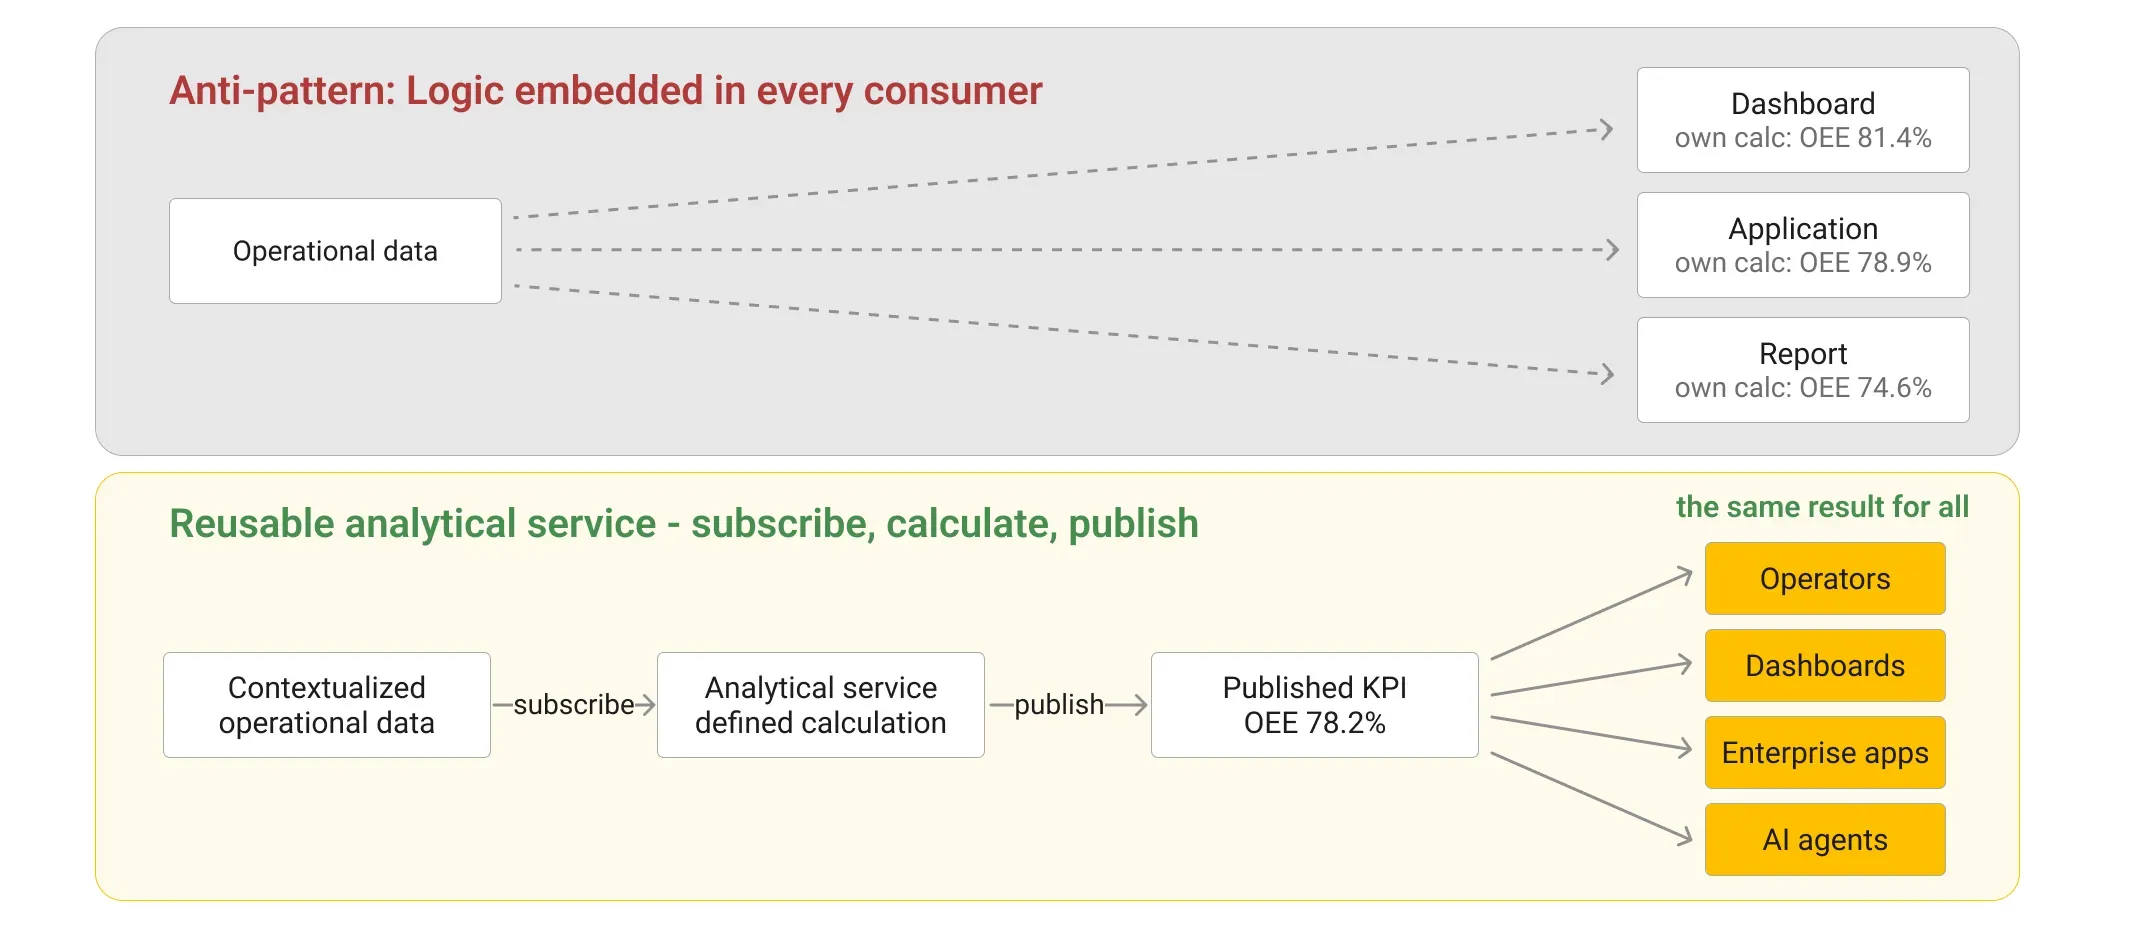
You should avoid embedding analytical logic independently in every dashboard, application, and report.
When each consumer calculates its own version of a KPI or detection rule, inconsistency becomes inevitable.
Instead, create reusable analytical services that subscribe to contextualized operational data, perform defined calculations, and publish the results as new operational information.
 These services may calculate:
Rolling production performance
Throughput and cycle-time indicators
Yield and reject rates
Process variability
Equipment utilization
Energy intensity
Quality trends
Deviation risk
Maintenance-condition indicators
Material-consumption variance
A service that calculates a metric once and publishes it for many consumers follows the same decoupled principle used in the Connect stage.
Operators, dashboards, enterprise applications and AI agents can all consume the published result without recreating the calculation.
Publish analytical insights back into the industrial data backbone
An insight should not remain trapped inside the application that created it.
Your analytical outputs should be published back into the shared operational architecture as governed events, states, scores, or KPIs.
For example, an analytical service may publish:
The current rolling performance KPI
The expected operating range
The direction and rate of change
The duration of the current condition
The assets or process segments involved
This makes the insight available through the same access layer as the underlying operational data.
A dashboard can display the KPI.
A workflow engine may can an investigation.
A notification service can alert a supervisor.
An AI agent can subscribe to the result and begin gathering additional evidence.
By publishing analytical outputs as first-class operational information, you make intelligence reusable across the enterprise.
An insight should not remain trapped inside the application that created it.
Detect patterns, not just threshold breaches
Simple thresholds remain useful, but they do not capture every meaningful condition.
A process may remain within its defined limits while showing a gradual drift. A line may experience repeated short stops that individually appear insignificant but collectively reduce performance.
Your analytical layer should therefore support several forms of detection.
These may include rules, rolling calculations, statistical methods, anomaly detection, pattern recognition, machine-learning models, and comparisons against historical or peer performance.
The correct approach depends on the problem.
A deterministic rule may be most appropriate when the condition is clearly understood and safety or compliance requires explainability. A statistical model may be better suited to identifying gradual process drift. Machine learning may help detect complex relationships across many variables.
You should not use more complex methods simply because they are available. Use the simplest method that produces reliable and explainable results for the decision you need to support.
Preserve evidence and explainability in operational intelligence
Every analytical output should carry enough information for a person or system to understand how it was produced. This includes the metric definition, calculation version, input sources, time window, transformations, quality indicators, model or rule used, and references to the underlying events.
In a quality-sensitive environment, you may need to reconstruct why a condition was classified as a potential deviation.
You should be able to determine which process values were evaluated, which batch phase was active, which material lot was being processed, which equipment state was observed, and whether any input was missing or marked as poor quality.
This is important for human trust. It is also necessary when an AI agent uses the analytical result as the starting point for an investigation.
An agent should not treat a calculated score as an unexplained fact. It should be able to examine the evidence behind it.
Support both human and machine consumption
Your analytical outputs should be designed for both people and systems. Human users need clear explanations, trends, comparisons, and visual context. Applications and AI agents need structured data, consistent schemas, quality indicators, and references to related operational entities. For example, a published KPI should not contain only a numeric value. It may also identify the line, current production context, calculation period, target, status, confidence, and evidence reference.
This allows a person to understand the situation quickly and gives an AI agent the structured context needed to decide what to investigate next. The same intelligence can therefore support an operator dashboard, a management review, an automated workflow, and an agentic AI use case without being calculated separately for each consumer.
Govern analytical logic across the enterprise
Analytical definitions will evolve as your processes and business requirements change. You need a governance model that manages these changes without creating confusion.
You should define how calculations and models are proposed, validated, approved, versioned, deployed, monitored, and retired. You should also define who owns each metric, who is permitted to change it, and how changes are communicated to consuming teams and systems.
When a calculation changes, the published result should identify which version produced it. Historical results should remain interpretable even after a new version is introduced.
This is particularly important when KPIs are used in regulated reporting, enterprise benchmarking or automated decision support.
What you should have at the end of the analyze stage
By the end of this stage, you should have a continuously operating analytical layer that turns contextualized events into trusted operational intelligence.
You should have standardized KPI definitions, reusable calculation services, governed rules and models, real-time pattern detection, evidence-backed analytical outputs, and a reliable way to publish insights back into your operational architecture.
Your teams should be able to identify developing conditions while they can still influence the outcome. Your applications and AI agents should be able to access the same insights through consistent, machine-readable interfaces.
At this point, your architecture can explain what is happening and identify where attention is required.
The next challenge is to decide what should happen as a result, and to ensure that any response is safe, governed, and accountable.
That is where Act begins.
Discover the full architecture story in the Building a scalable data foundation for real-time operational intelligence whitepaper.

Kudzai Manditereza
Kudzai is a tech influencer and electronic engineer based in Germany. As a Senior Industrial Solutions Advocate at HiveMQ, he helps developers and architects adopt MQTT, Unified Namespace (UNS), IIoT solutions, and HiveMQ for their IIoT projects. Kudzai runs a popular YouTube channel focused on IIoT and Smart Manufacturing technologies and he has been recognized as one of the Top 100 global influencers talking about Industry 4.0 online.