HiveMQ Edge 2025.19 is Released
What’s new in HiveMQ Edge 2025.19
HiveMQ Edge release 2025.19 is one of the most substantial releases this year for our OT Gateway, delivering significant improvements across several key areas:
- OPC-UA Adapter Enhancements: The adapter now offers crucial debugging and security features, including certificate validation control for TLS and connection health monitoring. This helps users bypass certificated TLS connections with OPC-UA if needed as well as more effectively diagnose and address connectivity issues with OPC-UA endpoints.
- Hardened MQTT Bridging: Connection handling and error management have been strengthened to provide users with a clearer understanding of connectivity conditions and improve overall bridge reliability.
- Workspace Upgrades: Further refinements have been made to the Workspace, improving layout controls and enhancing filter and search options, particularly benefiting larger scale deployments.
- Data Hub Designer Improvements: The Data Hub designer has received fixes and improvements designed to help users better understand policy success and assess the impact of policies before they are published.
OPC-UA Adapter Enhancements
This release adds the ability to disable TLS certificate validation for OPC UA adapters and significantly enhances connection stability through new health monitoring and automatic reconnection logic.
How it works
New configuration options have been introduced in the OPC UA adapter settings. Specifically, a new tlsChecks option allows users to control how thoroughly the default TLS certificate validation process for the OPC UA connection will be. Additionally, connection health monitoring has been implemented, which includes regular health checks, timeout handling, and automatic reconnection logic. A new service fault listener is also in place to force an immediate reconnect upon detecting fatal service faults from the OPC UA server.
How It Helps
Disabling TLS certificate validation provides greater flexibility when connecting to OPC UA servers in environments where certificate management is difficult or where self-signed/untrusted certificates are common. The enhanced connection health monitoring and automatic reconnection features drastically improve the reliability and resilience of the OPC UA adapters, minimizing connection downtime and ensuring more continuous data flow from your industrial assets to HiveMQ Edge.
Workspace Auto-Layout: Organize Your MQTT Architecture Effortlessly
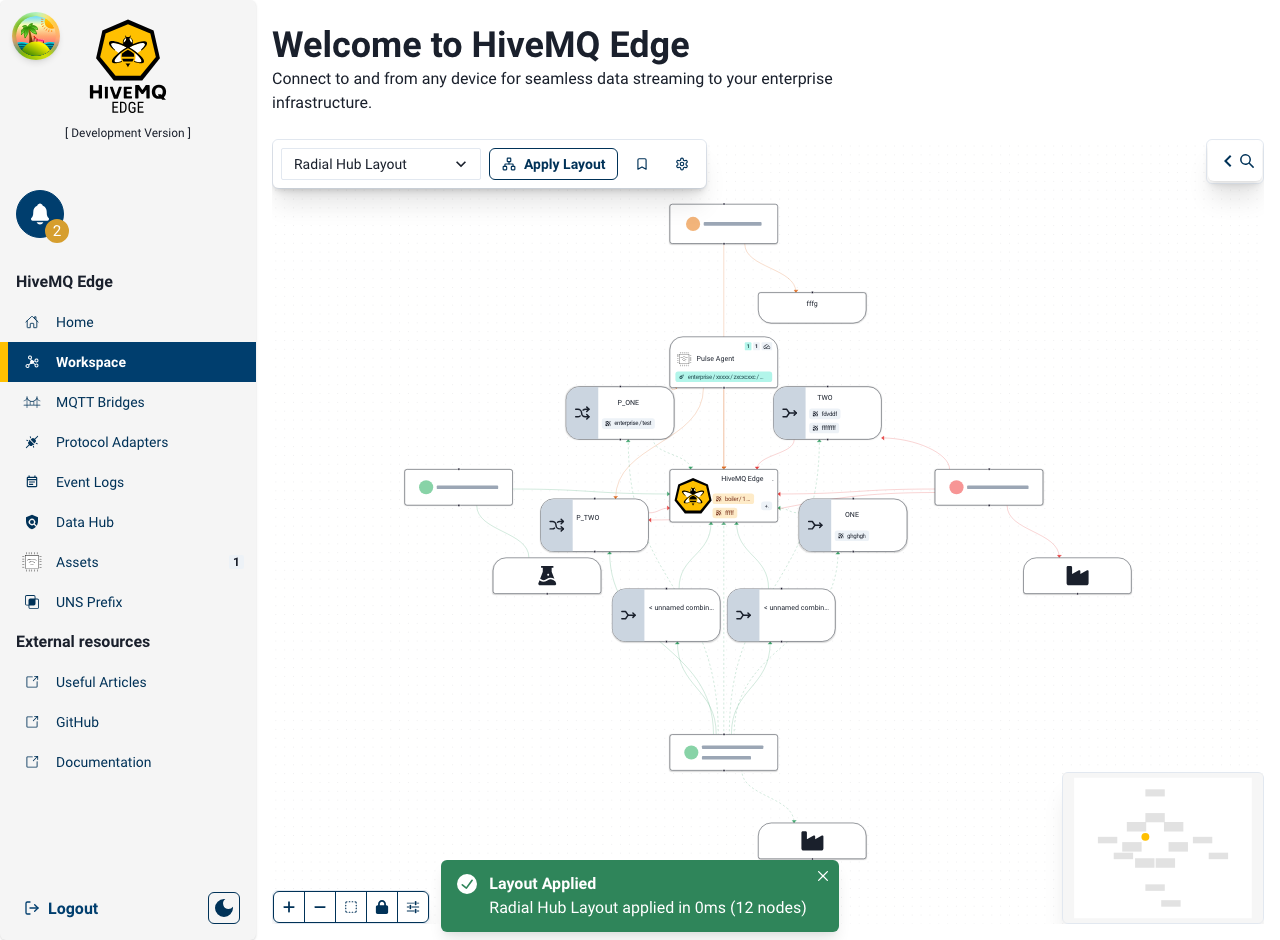
HiveMQ Edge now includes automatic layout algorithms that intelligently organize your workspace nodes. Instead of manually positioning each element, select a layout and let the workspace arrange your MQTT infrastructure in seconds.
The feature offers five professional algorithms, each optimized for different topology patterns:
- Dagre Vertical: Clean top-to-bottom flow, perfect for sequential architectures
- Dagre Horizontal: Left-to-right organization, ideal for wide screens
- Radial Hub: EDGE node centered with connections radiating outward
- Force-Directed: Physics-based organic clustering that reveals natural relationships
- Hierarchical Constraint: Strict layer-based organization for formal structures
How It Works
Open your workspace and locate the Layout Controls in the toolbar Select an algorithm from the dropdown menu Click Apply Layout to instantly reorganize your nodes Save as preset (optional) to reuse the same arrangement across workspaces
All layouts execute instantly—even complex calculations complete in milliseconds, so you can iterate freely and compare different arrangements.
How It Helps
The new visualization feature offers improved clarity for MQTT architecture by automatically arranging nodes with various layout options. These layouts allow users to quickly understand different aspects of their topology, such as linear data flows or unexpected clusters, with a single click. Users can also save these layouts as reusable presets, significantly speeding up the setup and organization process.
Unified Workspace Toolbar: Search, Filter, and Layout Controls Together
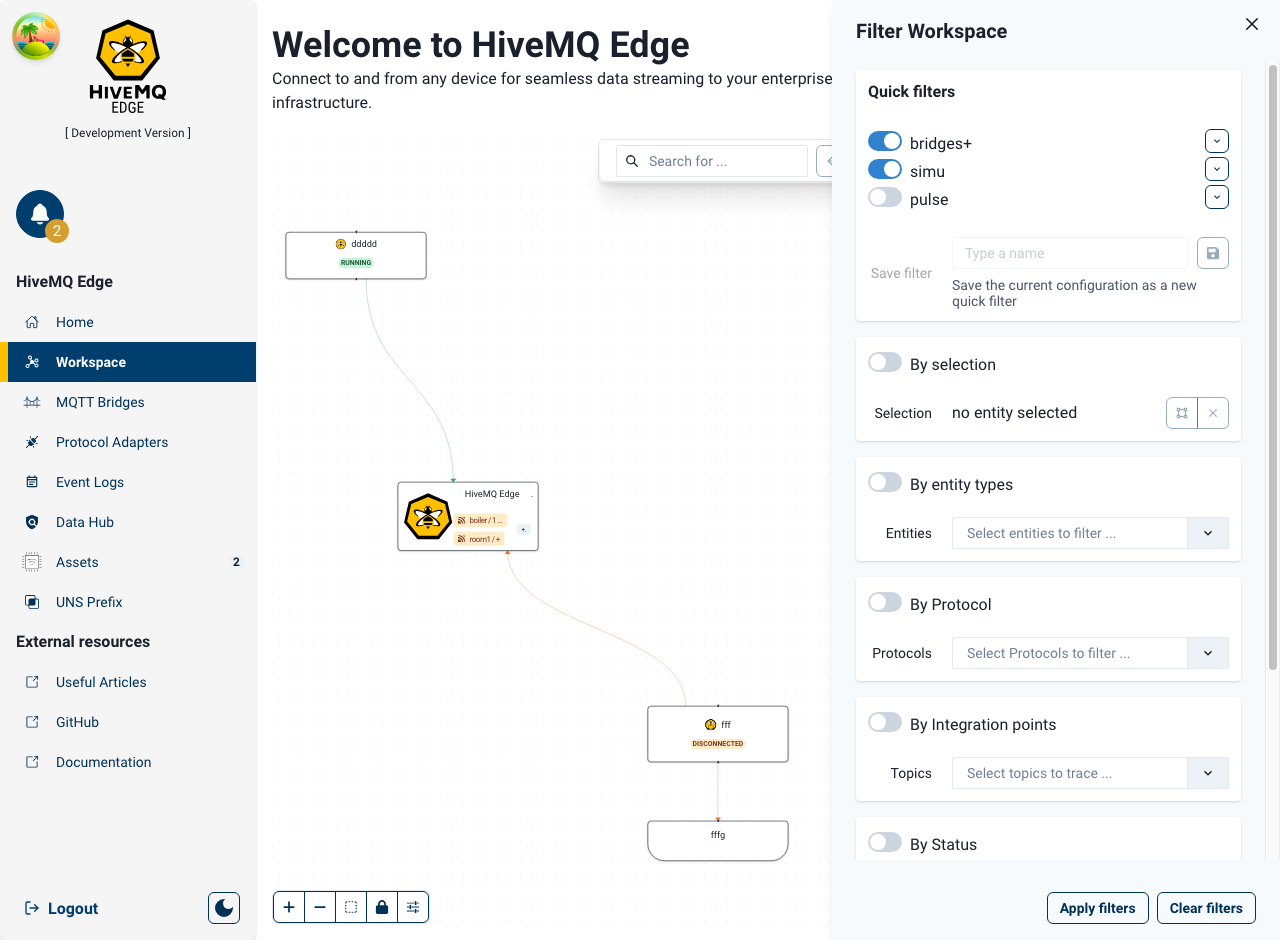
The workspace now features a single, collapsible toolbar that brings search, filter, and layout controls together in one convenient location at the top-left of your canvas. Instead of hunting across multiple toolbars, you'll find all your workspace organization tools in one place.
The toolbar has two logical sections:
- Search & Filter: Find entities quickly and apply custom filters to show only what you need
- Layout Controls: Organize your workspace with automatic layout algorithms and manage saved configurations
How It Works
- Expand the toolbar by clicking the expand button at the top-left of the canvas to reveal all controls
- Search for entities using the search input to quickly find adapters, bridges, or other nodes by name
- Apply filters to hide unwanted nodes—click the filter button to open the filter drawer and narrow your view
- Select a layout algorithm from the dropdown menu to automatically organize your workspace
- Click Apply Layout to reorganize your nodes instantly
- Manage presets to save and reuse your favorite layout configurations
- Collapse the toolbar when you want to maximize your canvas space—the toolbar shrinks to a compact icon
All controls respond instantly, and smooth animations keep the workspace feeling responsive. Your expanded/collapsed preference is remembered between sessions.
How It Helps
The text highlights four key features designed to improve user efficiency and focus within a workspace: instant searching and filtering for faster navigation and reduced clutter; one-click organization with various layout options; and the ability to collapse the toolbar to maximize screen space for design or analysis.
Workspace Status Visualization: See What's Running and What's Configured
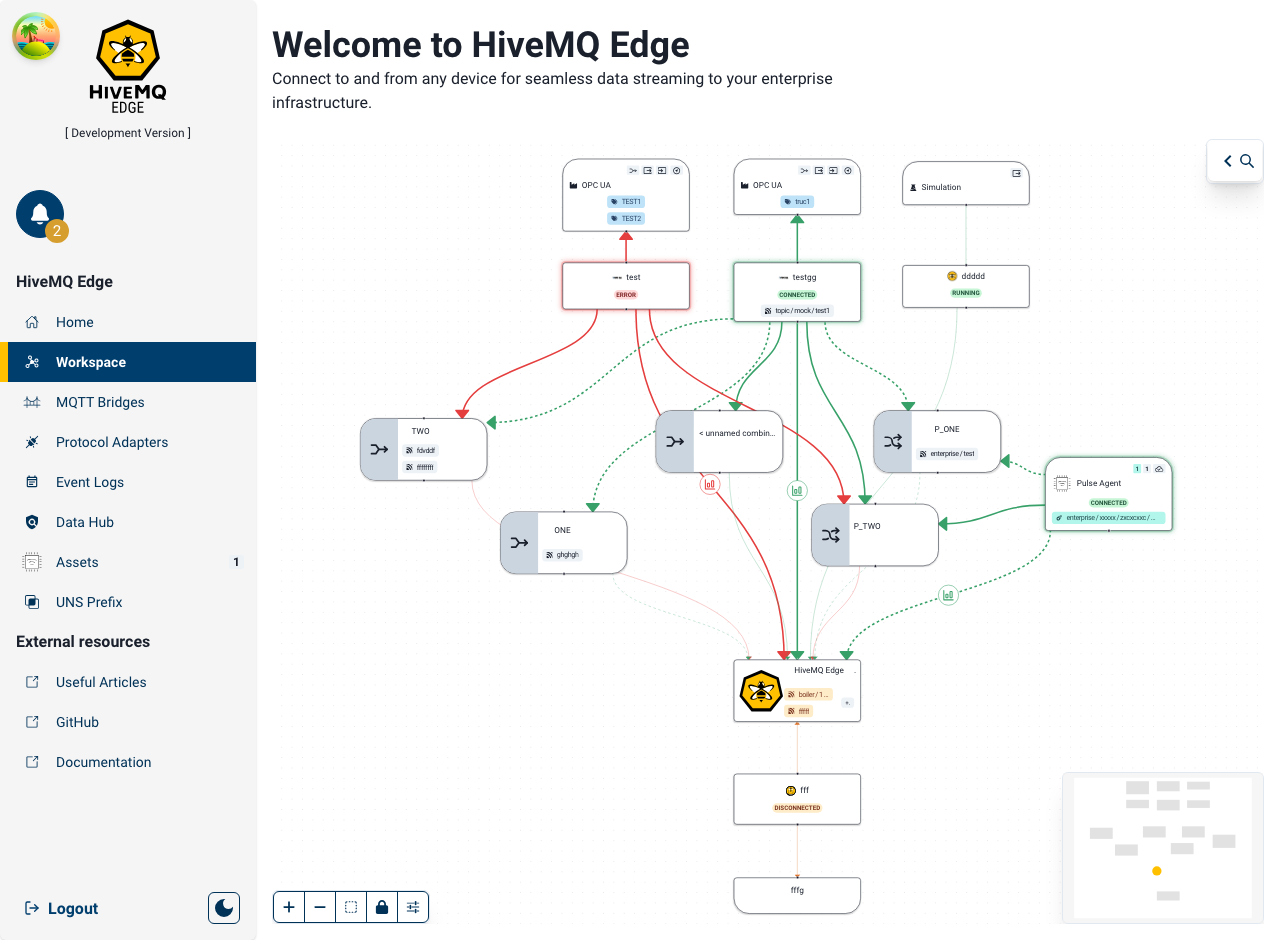
The workspace now provides clear, real-time status indicators for every node and connection in your topology. You can instantly see which parts of your MQTT infrastructure are running, which have configuration issues, and which are partially set up.
The status display uses two complementary indicators:
- Runtime Status (shown as color) Whether the node is actively running, inactive, or experiencing errors
- Operational Status (shown as animation) Whether the node is fully configured, partially configured (draft), or not configured
Each edge (connection) also shows its own operational status so you can see the complete picture of which data flows are ready to operate.
How It Works
- Look at node colors to see runtime status:
- Green - Active and running
- Yellow - Inactive but available
- Red - Error or stopped
- Watch for animated edges that indicate operational configuration:
- Animated edge - Fully configured and ready to operate
- Static edge - Partially or not configured
- Access the observability panel to see detailed status information and configuration state for any node or edge
- Check passive nodes (devices, hosts, combiners) which automatically show status based on their upstream connections:
- A device shows green if its adapter is active
- A combiner shows error if any input adapter has an error
- The Edge broker reflects the overall health of your topology
- Status updates in real-time as your adapters, bridges, and agents start or stop
The status propagation follows the natural flow of your topology, so understanding what's happening in one part of your infrastructure helps you understand the impact downstream.
How It Helps
The visualization system uses color (e.g., red nodes) and animation (e.g., static vs. animated edges) to provide an instant, at-a-glance understanding of a data flow's health, readiness, and configuration status. This visual feedback quickly highlights problems, confirms end-to-end configuration, and shows the readiness of data flows without needing to navigate status panels.
Policy Success Summary: Understand Your Impact Before Publishing
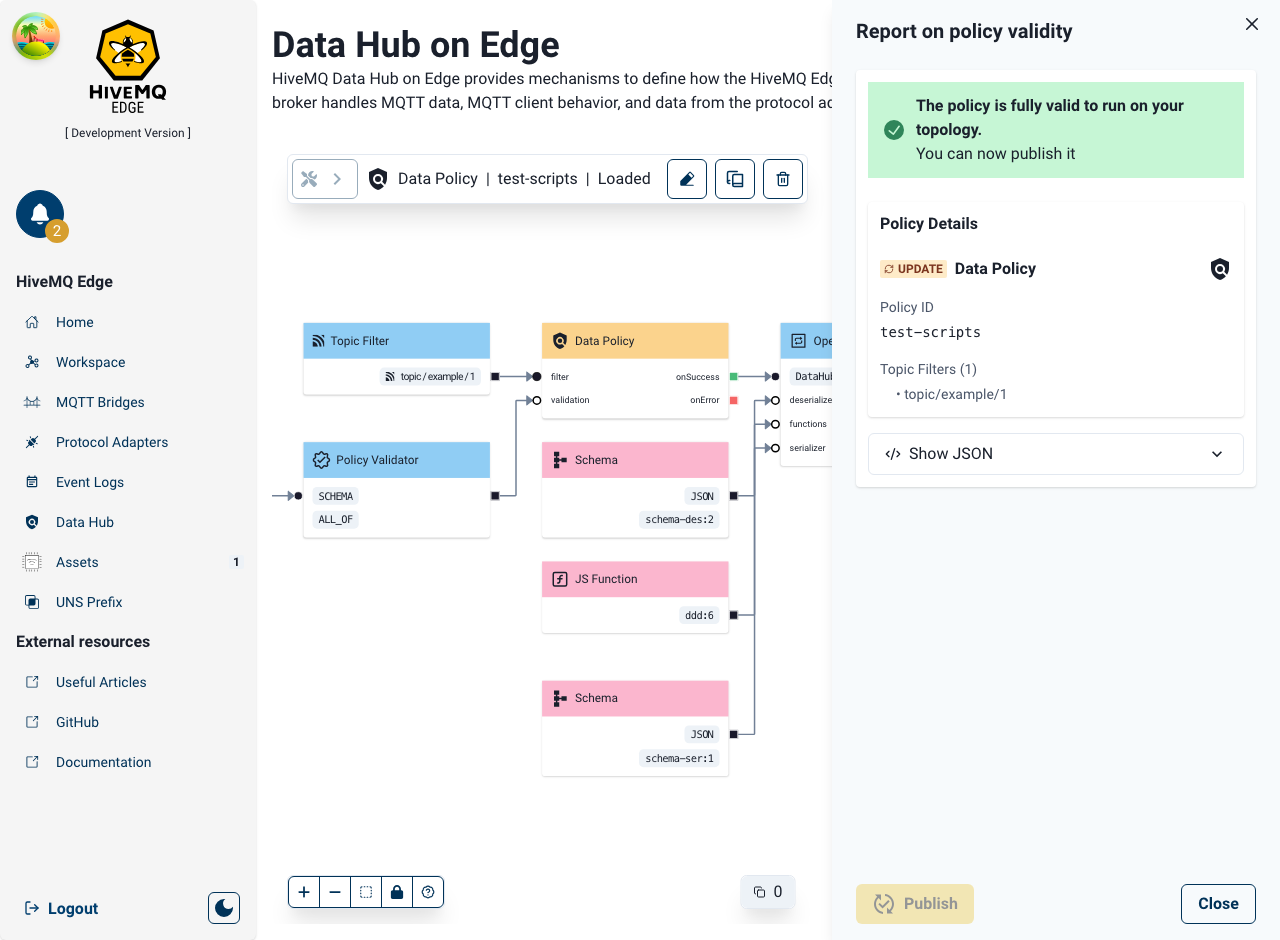
When you validate a Data Hub policy, you now receive a comprehensive success report instead of just a confirmation message. This report shows you exactly what will be created or modified before you click publish, giving you confidence in your changes.
The success summary includes three key sections:
- Policy Overview: Quick snapshot of your policy with its ID, type (Data or Behavior), and key configuration details
- Resources Breakdown: Complete list of all schemas, scripts, and transformations that will be created or modified, with status indicators for each
- JSON Payload View (optional): Collapsible, syntax-highlighted display of the complete policy configuration in JSON format with separate tabs for policies, schemas, and scripts
How It Works
- Design your policy in the Data Hub designer using the visual interface
- Click Validate to check if your policy is correct
- Review the success summary that appears showing what will be published
- Examine resources in the breakdown to see all schemas and scripts involved
- Check JSON details (optional) by expanding the JSON view if you want to see the raw configuration
- Click Publish with confidence knowing exactly what changes will be made
The summary displays automatically when validation succeeds. All resources are clearly labeled as either "New" or "Update" so you understand which items are being created versus modified.
How It Helps
Whether you're creating a new policy or updating an existing one, the status badges and comprehensive summary give you the confidence to publish without uncertainty. The input text outlines key steps and benefits for reviewing and publishing policy changes. These include: reviewing all created/modified resources before publishing, understanding dependencies between schemas and scripts, verifying the configuration using a JSON view with syntax highlighting, and trusting changes based on status badges and a comprehensive summary.
Improvements
🛠️ Bug Fixes
- The report and status of validation in the DataHub Designer is now properly cleaned up when changing policies
- The Observability links in the workspace have been fixed
- Modbus, Database, and other adapters:
- Fixed stop() methods to properly clean up resources
- Prevented operations from executing after stop() is called
- Fixed race conditions when bridges are deleted/created
- Fixed adapter race conditions and shutdown issues
🚀 Improvements
- The code-highlighting editor for Scripts and Schemas has been significantly improved in the DataHub Designer
- The Script and Schema edit/review/publish flow in the Data Hub Design has been improved
- The layout and search/filter functionalities are now all located in the same toolbar in the workspace
- The list of protocol adapters is now properly sorted in the catalogue
- Improve code coverage configuration
- Protocol Adapter lifecycle management improvements including error handling
- API Error handling improvements
Deprecation Notice
HiveMQ Edge was migrated to JDK v21 in version 2025.16, HiveMQ Edge will need to be run in the Java run time environment for v21 or higher.
JDK v21 provides many enhancements and improvements to the efficiency and performance of HiveMQ Edge, and enables future data operations capabilities to be brought to the product.
Should you need to run HiveMQ Edge on a 32bit Architecture, or are already running Edge on a 32bit architecture then you should not use any version after 2025.15.
Get Started Today
Use the download link Get HiveMQ Edge 2025.19, or find us on GitHub and Docker:
Get started by running
docker run --name hivemq-edge --pull=always -d -p 1883:1883 -p 8080:8080 hivemq/hivemq-edge
Or clone our repository
git clone git@github.com:hivemq/hivemq-edge.git
You may also try out our Helm Chart
helm repo add hivemq https://hivemq.github.io/helm-charts && helm repo update
HiveMQ Team
Team HiveMQ brings together deep expertise in MQTT, Industrial AI, IoT data streaming, UNS, and Industrial IoT protocols. Follow us for practical deployment guidance, best practices for building a secure, reliable data backbone, and insights into how we are shaping the future of connected industries.
Our mission is to transform industrial data into real-time intelligence, actionable insights, and measurable business outcomes.
Have questions or need support? Contact us. Our experts are ready to help.

