How OpenTelemetry Enhances Distributed Tracing of MQTT Messages
What is OpenTelemetry?
In simple terms, OpenTelemetry (OTel) is an open-sourced collection of tools, APIs, and SDKs that provide a standard format framework for how observability data is collected and sent.
OTel is used to instrument, collect, generate, and export telemetry data to help you analyze and understand a software’s (e.g. IoT application) performance and behavior. It provides unified sets of libraries and APIs primarily used for data collection and transmission.
What is Telemetry Data?
Telemetry data is a collection of logs, metrics, and traces generated from software or IoT applications.
The broad mass of OpenTelemetry data comes from backend applications running in data centers. Usually, IoT devices sit in remote, inaccessible areas; however, the major challenge is not their remote location, but collecting data from logically complex architectures and deployments.
For instance, many environments have Kubernetes cluster with 5,000 pods. Say only 80 of these clusters are involved in processing a request; and if there is a sporadic high latency, where should teams start looking for the problem?
Capturing telemetry data in IoT environments is critical to understanding how your IoT applications perform. This performance data is gathered and then processed by Application Performance Monitoring (APM) tools, such as Datadog, Honeycomb, etc.
What are Telemetry Data Logs?
Logs are readable files that show the results of any transaction in your IoT ecosystem. They provide a continuous, event-based record of these transactions and make it easy to correlate any issues or irregularities.
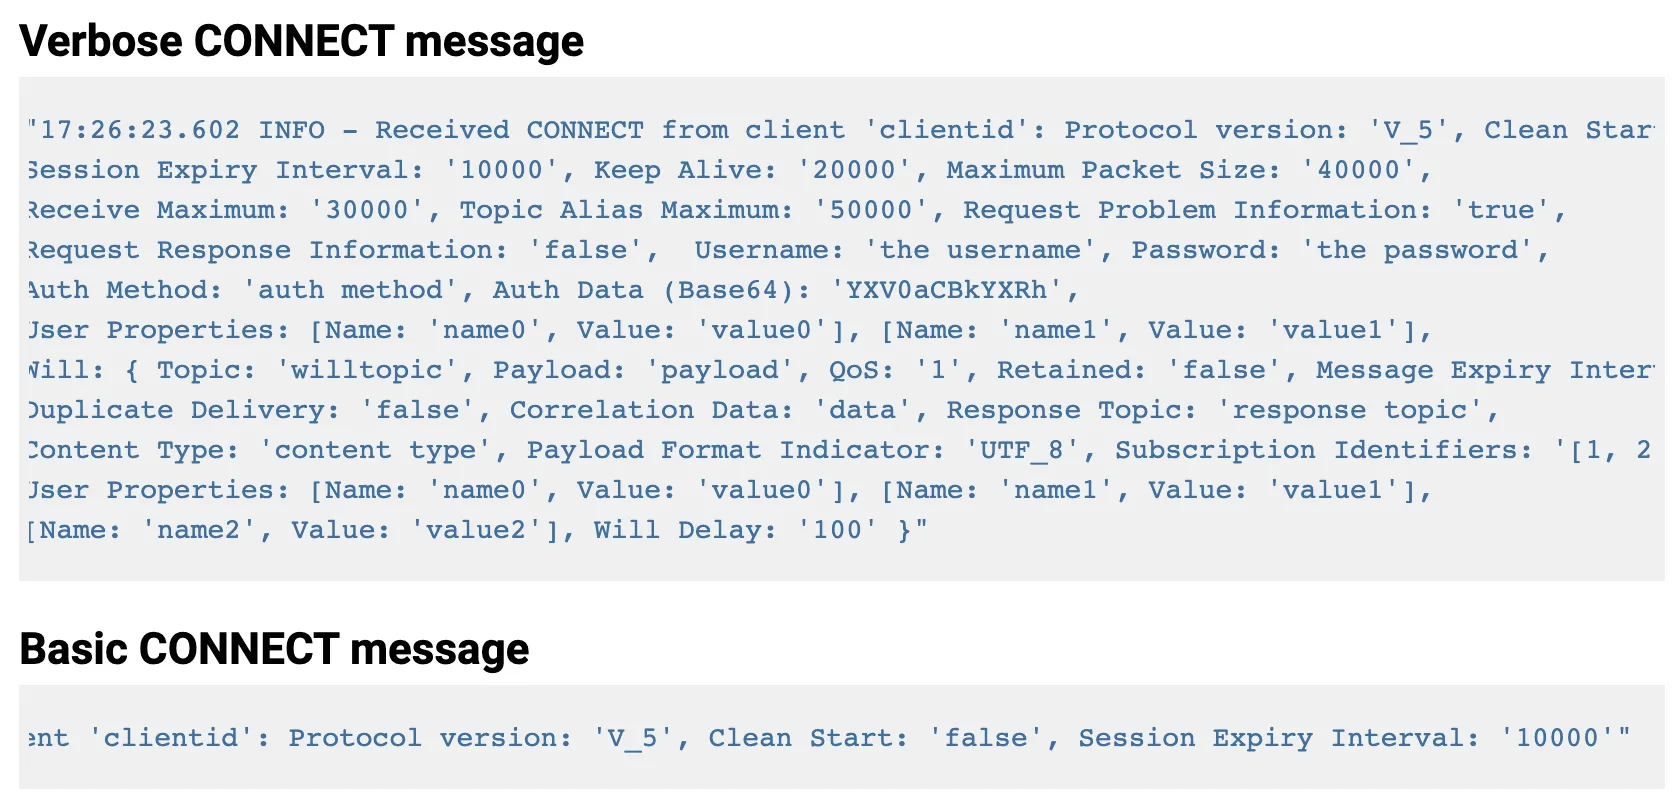
For instance, a plain text CONNECT log (shown below) can help you identify where an error might have occurred or which part of the process may be causing latency in the transaction.
Logs can be structured, unstructured, or plain text. Each type of log serves a specific purpose for it’s users.
 HiveMQ’s message log extension is helpful for application debugging and development. It enables engineers and developers to follow up on any clients communicating with the HiveMQ broker on the terminal.
What are Telemetry Data Metrics?
Telemetry data metrics are time-aggregated data points (counts, timestamps, values, or event names). Metrics can be extracted simply by querying the databases that store them.
For instance, a metric can be the numeric value of a moment in time (e.g., like CPU % used). Generally, every metric has a timestamp, a name, and one or more numeric values. Here’s what a metric might look like in a database:
| Time Stamp | Metric Name | Count |
|---|---|---|
| 22/08/2022 08:10:10 | CPU Usage | 10% |
The OpenTelemetry Collector — an application that allows you to process that telemetry and send it out to various destinations — can be used to collect HiveMQ cluster metrics via the Prometheus or InfluxDB extension. In the picture below, you can see a quick view of Cluster Metrics from HiveMQ’s Control Center dashboard:
 Here’s what each metric means:
| Metric | Description |
|---|---|
| Connections | Current amount of active connections on all nodes |
| Inbound Publish Rate | Current amount of incoming Publishes per second over all cluster nodes |
| Outbound Publish Rate | Current amount of outgoing Publishes per second over all cluster nodes |
| Subscriptions | Current amount of Subscriptions and replicas stored in the cluster |
| Retained Messages | Current amount of Retained Messages and replicas stored in the cluster |
| Queued Messages | Current amount of Queued Messages and replicas stored in the cluster (may show Queued Messages of already disconnected clean session clients) |
| Cluster Nodes | Current amount of Cluster Nodes |
Monitoring metrics is vital to proactively identify and fix issues before they grow into larger, more complex problems
What are Telemetry Data Traces?
Traces are all about tracking processes end-to-end (e.g., tracking API requests). Tracing can help developers understand how services connect and the entire IoT ecosystem. Tracing can also help developers knowif the system is working correctly, and if it isn’t, they can quickly start troubleshooting it because they know where to look.
Tracing includes unique identifiers, operation names, timestamps, logs, events, and indexes.
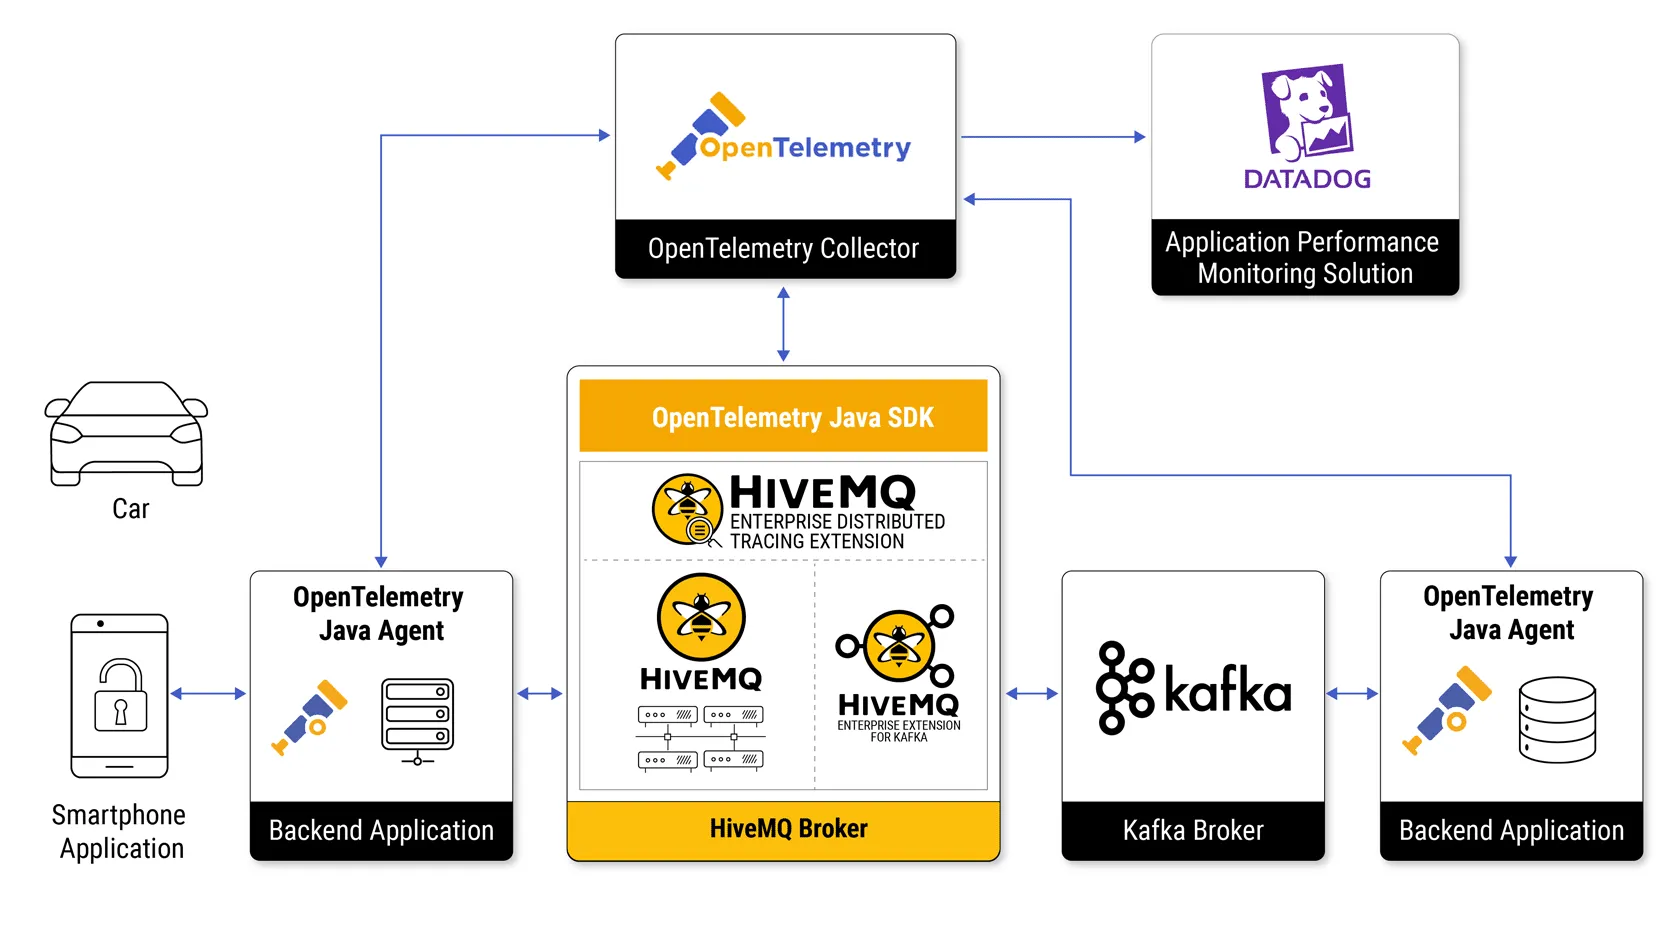
The illustration below shows an example of a transaction (unlocking a car door via a mobile app) going through an IoT environment.

A customer sends a request via the app to unlock their car’s door.
The request is received in the web server, processed (in HTTP), and a Trace ID is generated and attached to the message.
Next, the web server sends the message to the HiveMQ broker (in MQTT) for further processing.
The Broker receives the message (along with the trace ID) and sends it to two entities:
First it forwards the message to the Kafka broker (via HiveMQ’s Kafka extension) with the same Trace ID.
Second, the broker delivers the message (via its Distributed Tracing Extension) to an Application Performance Monitoring (APM) solution (Datadog, Grafana Tempo) using the OpenTelemetry framework. This ensures the APM solutions get the message in a standardized format.
Finally, the Kafka broker receives the record and sends it to the backend application for further processing.
The backend application queries the database to process the request and transmits the result via Kafka.
After the message is processed and authenticated, the broker sends it to both the car and the phone. The car receives an ‘unlock door’ command (via Kafka) - either a success or failure (error). The message is also sent to the phone application (via Kafka) that the car’s door is unlocked.
It is important to note that these transactions happen in milliseconds, so a slight delay (latency) in message delivery/processing can be very problematic.
Let’s see how this message (with its Trace ID) would appear in a database.
| Time Stamp | Trace ID | Service ID | Duration (seconds) |
|---|---|---|---|
| 22/08/2022 08:10:10.10 | 123456 | Phone Application | 0.1 |
| 22/08/2022 08:10:10.30 | 123456 | Web Server | 0.20 |
| 22/08/2022 08:10:10.40 | 123456 | MQTT Broker | 0.10 |
| 22/08/2022 08:10:10.62 | 123456 | Kafka Broker (Produce) | 0.22 |
| 22/08/2022 08:10:10.65 | 123456 | Kafka Broker (Consume) | 0.25 |
| 22/08/2022 08:10:10.90 | 123456 | Backend Application | 0.28 |
From the example above, we can clearly see which stages of the process that are taking too long to process. For instance, if it takes 0.28 seconds for the message to transmit from the Kafka broker to the Backend Application, we know there is a time lag (latency) that must be addressed. Engineers now know (because of the trace ID) which message is causing the problem and at what stage. They can then start fixing the problem.
How Does OpenTelemetry Work?
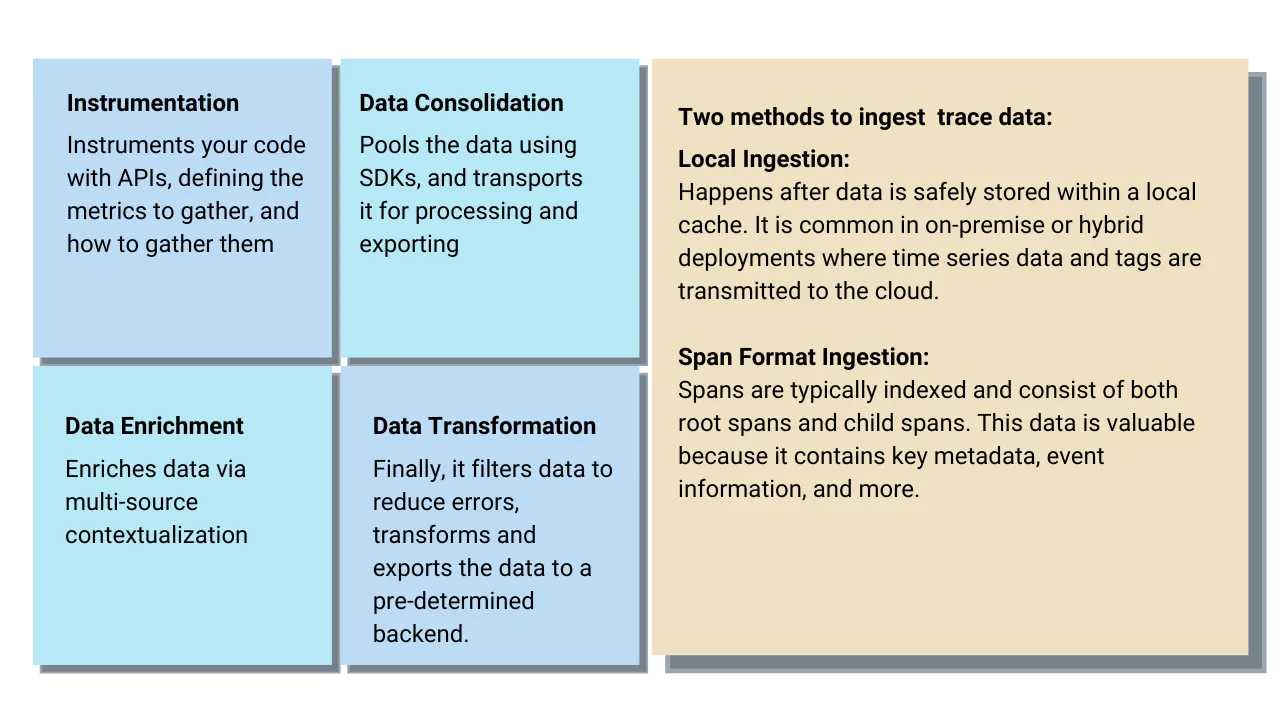
OpenTelemetry features specialized protocols that collect telemetry data and export it to an identified system. The diagram below illustrates OpenTelemety data lifecycle.

With Native OpenTelemetry Integration, HiveMQ Enables Distributed Tracing
Organizations usually deploy IoT applications in a distributed environment. The messages exchanged within this setup must transit through multiple components, including MQTT brokers.
For DevOps and SRE teams, it is essential to have the ability to trace these messages throughout their distributed environment. Unfortunately, most MQTT brokers cannot continuously gather metadata on requests/messages, which creates gaps that impact the service level objectives of the responsible teams.
HiveMQ solves this problem with the help of Distributed Tracing. Distributed Tracing is a method to follow messages through multiple and complex systems. It allows a high-level overview of a message’s journey so teams analyzing issues can isolate potential problems and dive deeper into systems.
HiveMQ’s OpenTelemetry integration allows you to trace and debug MQTT data streams between devices and cloud service providers in real-time. The HiveMQ broker, with the Distributed Tracing Extension, offers OpenTelemetry capabilities that extend to traffic transiting the Enterprise Extension for Kafka.
To dive deeper into “how” distributed tracing boosts what you observe with your systems, read Distributed Tracing maximizes the Observability of your IoT applications. To learn how to start monitoring OpenTelemetry traces from HiveMQ in an APM tool, like Datadog, read this article Use HiveMQ and OpenTelemetry to monitor IoT applications in Datadog.
What Role Does OpenTelemetry Play in IoT Observability?
IoT Observability is a method that defines how users (engineers and developers) get granular visibility into their IoT applications’ key components and metrics.
IoT Observability enables users to:
Debug their IoT applications quickly because they have more precise insights.
Improve their IoT applications by quickly identifying critical issues and solving them before they become insidious problems.
Develop a deep understanding of how their IoT applications work in the broader distributed structure.
An essential part of IoT observability is tracing ‘events.’ Events are simply instances where data is transferred from a publisher to a subscriber, via an intermediary ‘broker’ like HiveMQ. Tracking events is important because if there is a situation where the subscriber didn’t receive data, teams should know where to look for potential issues.
With the help of a broker, OpenTelemetry can generate a trace to confirm:
If a publisher actually sent the event, and
When a consumer initially receives an event.
This proof helps authenticate that the data transfer occurred; if not, teams know which side (publisher or subscriber) failed.
Learn more about OpenTelemetry and IoT Observability here.
Conclusion
To summarize, OpenTelemetry standardizes telemetry data. When an application monitoring tool like Data Dog, Honeycomb.io, etc. receives data, it makes the information observable and displays it in an easy-to-read form. Teams can then see how their IoT applications relate to each other and explain why things aren’t working as expected.
Contact our team to learn more how HiveMQ Enterprise MQTT broker uses OpenTelemetry standard and distributed tracing for end-to-end IoT observability.

Nasir Qureshi
Nasir Qureshi is a Senior Product Marketing Manager at HiveMQ. With a passion for working on disruptive technology products, Nasir has helped SaaS companies in their hyper-growth journey for over 3 years now. He holds an MBA from California State University with a major in Technology and Data Management. His interests include IoT devices, networking, data security, and privacy.
