mqtt-spy - HiveMQ MQTT Toolbox
Short profile
| Attribute | MQTTBox |
|---|---|
| Type | Graphical user interface, JavaFX-based |
| License | Eclipse Public License & Eclipse Distribution License |
| Operating Systems | Any that supports Java 8 (e.g. Windows, Linux, MacOS) |
| Website | http://kamilfb.github.io/mqtt-spy/ |
General information
mqtt-spy is probably one of the most advanced open source utilities for publishing and monitoring activity on MQTT topics. It is aimed at two groups of users:
innovators who need a tool for creating IoT prototypes or integration projects*
power users who need an advanced utility for their work environments*
Hopefully after reading this and following blog posts (yes, there will be more!) you will be able to see if mqtt-spy is for you or you would be better off with one of the great alternatives out there.
Including this, there will be 3 blog posts about the “mqtt-spy” family:
this post gives an overview of the mqtt-spy GUI utility
the second post will cover mqtt-spy-daemon (the headless/console-based version of mqtt-spy) and its integration capabilities
the last post will cover some of the advanced features of both mqtt-spy and mqtt-spy-daemon, including:
advanced publications (scripting)
subscriptions and advanced processing capabilities (formatting, scripting, advanced searching)
message logging, replay and off-line browsing
automated testing & test cases
Design goals
The project was started in early 2014 with the aim of simplifying development and test activities for MQTT-based systems. Particularly those that generate at least a few hundred messages per second and use custom message envelopes with either encoded, signed and/or encrypted payloads.
The first design goal was to make it useful for debugging and fault investigation - to sieve through hundreds or thousands of messages arriving each second that spread across tens or hundreds of topics - and still being able to find the ones of interest.
The second design goal was to make mqtt-spy as user-friendly as possible while retaining its advanced capabilities. To help you with finding your way around it there is an extensive wiki available on the project’s home page.
MQTT compatibility overview
| Feature | Available |
|---|---|
| MQTT 3.1 | Yes |
| MQTT 3.1.1 | Yes |
| LWT | Yes |
| SSL/TLS | Yes |
| Automatic Reconnect | Yes |
| MQTT over TCP | Yes |
| Feature | Available |
|---|---|
| QoS 0 | Yes |
| QoS 1 | Yes |
| QoS 2 | Yes |
| Authentication | Yes |
| Scripting | Yes |
| MQTT over Websockets | Yes |
Unique features
This brief section lists some of the unique features of mqtt-spy and what makes it different from other tools:
Support for multiple concurrent connections
Automatic reconnection and multiple server URIs
Advanced TLS/SSL support with all common key store types: JKS, JCEKS, PKCS12 and BKS
Summary of all topics & messages received for each of the subscriptions – with topic searching and filtering
Browsing, searching and filtering on received messages – easily handling 100s of messages per second
Message content formatting to support custom message envelopes (e.g. encoded, signed and/or encrypted payload)
Message log – an audit file can be created for all received messages; this could be used for replay or off-line browsing and analysis
Export of topics and messages, including support for large binary files
Perspectives and customisable pane visibility (hidden, collapsed, expanded, detached to a separate window)
Processing statistics – messages per second over 5s, 30s and 5m intervals, plus the overall number of topics and messages received
Charts with pan and zoom – for message payloads and statistics
Automated testing with test cases
Usage
Start Up
mqtt-spy is made available for download as an executable Jar file. This means it requires an appropriate version of the Java Runtime Environment to be installed on your operating system. Once downloaded, just double click on the Jar file and mqtt-spy should start.
It is also possible to start mqtt-spy through the command line, run it with a specific version of Java (not just the default) or run it with additional libraries - see Getting Started for more details.
First steps
Every time you open mqtt-spy you are going to see the control panel (see below). It gives you a quick summary of the configuration that’s been loaded (first two sections), the update status (checked at start-up) and some basic statistics about usage. When using mqtt-spy for the first time, it is recommended you create a configuration file with sample content – this will give you a list of public MQTT brokers/servers to which you can just connect and start experimenting with. You can also re-create the configuration file at any point from the “Configuration” menu.
Click on the “No configuration file found” info to bring the configuration wizard (or do if from the “Configuration” menu): For new connections or to charge configuration of the existing ones go to the “Connections” menu.
Connecting to an MQTT broker/server
When you have you connection configured, there two ways to connect to an MQTT broker/server:
From the “Manage connections” window (Menu -> Configuration -> Manage connections), by clicking on the “Open connection” button

From the “Control panel”, by clicking on the button with the name of your connection

Once opened, a new connection tab will appear. To indicate secure connections, there are two icons available (if not enabled, they are not shown):
User authentication enabled
TLS/SSL enabled
Another important bit is the tab colour:
Grey: no connection attempt yet
Yellow: connecting
Green: connected
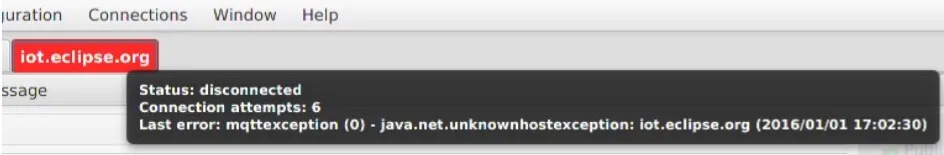
Red: couldn’t connect / connection lost
The connection tab’s tooltip gives additional information about your connection (where applicable): connection status, last update, number of connection attempts, last error, authentication status, TLS/SSL status.
 The last important aspect of the connection tab is its context menu, giving you access to broker’s statistics and various UI settings.
Simple subscription
OK - now let’s take a look at subscriptions and how to receive messages. To create a subscription, put the subscription topic (can include wildcards like + or #) into the Topic field and either hit Enter or click the Subscribe button. This should create a new subscription tab, in which you will see all received messages matching this subscription.
Again, the subscription tab has got a context menu, which gives you access to some of the key features like charts. To select the QoS for the subscription, make sure you change to a detailed perspective (Menu -> Window -> Change Perspective).
Simple publication
With a subscription now in place, we can try publishing a message. Put your publication topic and the payload you want to send, and click the Publish button. This should result in a message being published, and if it matches your defined subscription, you should see a message in the subscription tab.
 To select the QoS for the publication, make sure you change to a detailed perspective (Menu -> Window -> Change Perspective).
Message browsing
mqtt-spy takes a different approach to message browsing. Rather than displaying the received messages as a graphical list, only one message is shown at a time. By default, the latest/newest message is shown – this gives you an insight into what’s going on on the browsed topic(s). You can disable showing the latest by deselecting the “Show latest” checkbox.
You can navigate to the message you want to see in a number of ways. You can either use the navigation buttons, mouse scroll when over the message index field or the navigation keys (up/down arrows, page up/down, home/end) when having focus on the index field. This is to allow you to look at messages in real-time, or messages received at certain points in time, even if you are receiving hundreds of them per second. What is important to remember is that mqtt-spy keeps buffering the received messages so that you can inspect them at a later time. By default, this is the newest 5000 messages per subscription. This means that when you hit the limit, old messages are deleted, and newly arrived ones are added. The latest has always got the index of 1.
Note: in the future, there will be an alternative to the “one message at a time” - it will be possible to display received messages as a list - in a similar way to how the search results are displayed.
Message searching
Apart from just browsing the received messages, you can also search for them. To do this, click on the Search button, create a new “search tab”, and put it the text you want to find in the payload. You can make the search case sensitive, and enable auto-search, so that when new messages arrive, they will be matched against your search criteria. Once happy with the search options, hit Enter or click the Search button - this will trigger the search results being displayed. The 3rd blog post will cover the advanced search: with script files and inline search scripts.
Topic summary
Apart from the message browser, each subscription tab also has a summary of the received topics and messages. This summary is effectively a list of all topics matching the defined subscription. Each entry in the table also shows you the last message received, total number of messages currently stored for that topic, and time of last message.
The topic list also acts as a selection criteria to what messages to browse in the message browser pane. As an example let’s assume we are receiving messages on 3 topics that match a single subscription. If you are only interested in the first topic, you can deselect all other topics in the Browse column, and the message browser will then only show you the messages for the selected topic.
If you are not sure about what’s the exact topic string, you can search for it in the provided text field – this acts as a filter for the table, but doesn’t change your browsed topics. The topic summary table also gives you access to more charts and browsing options via the context menu – right click on any of the topics to see all options.
Statistics
There are three types of statistics that mqtt-spy gives you access to:
Aggregated processing statistics - available on the Control Panel – keep clicking on the panel to wiz through all stats

MQTT broker statistics - accessible through the connection tab’s context menu – these depend on the specific MQTT broker (some brokers don’t offer this feature so you might see nothing)

Real-time processing statistics referred to as “load” – this is available for each of the subscriptions, and for all subscriptions combined – you will find it in the right hand side of the “Received messages summary” pane title – provided as an average over the last 5, 30 and 300 seconds

Exporting data
There are three ways of exporting data from mqtt-spy:
Copying individual elements like the payload or a topic to the clipboard From the message browser window (by selecting and copying the values manually) From the summary table (by using the context menu)
Using the export functionality (Tools button -> Export), which allows you to export various lists of topics or messages Current or all browsed messages (available options: clipboard, message log format, binary - could be used for (large) files, e.g. images) Currently browsed topic, all browsed topics, all filtered/searched topics or all topics – all go to the clipboard - Message log (to be covered in the 3rd blog post)
User interface customisation
There are a few ways of customising the user interface to suit your needs or typical usage.
First - there are perspectives. These are pre-configured sets of visible panes or level of detail.
Second - each connection tab can be customised individually. Right click on the tab and select the View menu. This gives you access to all the options like switching between detailed and simplified views, making the message pane resizable, detaching the connection tab and hiding/showing the individual panes.
Third - you can manually resize the split between the message pane and summary pane. You can also hide/detach panes – see the small “settings” button in the right hand side of the pane title.
Worth a mention is that mqtt-spy will also automatically remember the size of the main application window, so the next time you run it - the size will be as you left it.
Charts
Charts are one of the unique features of mqtt-spy. There are two categories of charts available:
Message processing charts (e.g. number of messages received, size, etc.)
Message payload-based charts (e.g. plotting temperature readings on 3 topics)

All line-based charts support pan & zoom capability – for details see https://github.com/eclipse/paho.mqtt-spy/wiki/Charts
Advanced configuration
mqtt-spy allows you to configure or enable the following features, independently for each connection. All can be changed by going to Menu -> Connections -> Manage connections:
Automatic reconnection (Connectivity tab) o Reconnect on connection failure Reconnection interval Automatically re-subscribe to topics
Last Will and Testament (Last Will tab)
User authentication (Security -> User auth. tab)
TLS/SSL (Security -> TLS tab)
Pre-configured publication topics and scripts (Publications tab)
Pre-configured subscriptions and scripts (Subscriptions tab)
Other connection-specific options (Other tab) Auto-open the connection tab on start-up Auto-connect opened connection tabs Auto-subscribe to all pre-configured subscriptions Maximum number of messages to keep for each subscription (always stores the newest) Minimum number of messages to keep for each topic when the above max has been exceeded Content formatter – typically used for extracting message payload from any custom-message envelopes; dealing with encoding, digital signatures and encryption For more information on how to configure TLS/SSL certificates see the project’s wiki page: https://github.com/eclipse/paho.mqtt-spy/wiki/TLS
Eclipse Paho
For all its MQTT connectivity, mqtt-spy uses the Eclipse Paho Java client – a rock-solid library allowing applications to connect to any MQTT-compliant broker.
As of January 2016, mqtt-spy & mqtt-spy-daemon are also part of Eclipse Paho & Eclipse IoT.
Contributions and UNICEF donations
All contributions to the project are very welcome! Whether it is a bug report, a feature request, a bug fix, a feature implementation or just a suggestion – they are all very much appreciated. Get in touch via the GitHub page or Twitter.
There is also a suggestion to donate to UNICEF from time to time if you like and use mqtt-spy on a regular basis. You can do it via https://www.justgiving.com/mqtt-spy or directly on UNICEF websites - any donations count, big or small!
What’s next…
Next week the MQTT Toolbox will look at mqtt-spy-daemon, the headless (console/command line-based) version of mqtt-spy. You can subscribe below to get notified as soon as the next blog post is available.

Kamil Baczkowicz
Kamil is a Technical Architect at Resonate. He's been working with MQTT and other messaging technologies since 2009 as part of the IECC Scalable development programme - the leading railway signalling control system in the UK.


