 TL;DR
The difference between a wall-mounted screen that gets ignored and a tool that drives real decisions comes down to one thing: context.
- A dashboard is only as trustworthy as the context attached to each data point; raw MQTT messages without metadata like unit, source and timestamp quality lead to misleading visualizations.
- Structuring your MQTT topic hierarchy around ISA-95 levels (site, area, line, cell) gives every metric a clear origin, making filters and drill-downs intuitive for operators.
- Real-time KPI panels for OEE, throughput and quality require contextualized data, not just live sensor feeds, to avoid common pitfalls like double-counting or stale readings.
- HiveMQ Connect provides the reliable, scalable foundation for streaming plant-floor data, and HiveMQ Platform adds the semantic context that turns raw telemetry into trustworthy information.
Who this blog is for: OT, data and IIoT engineers who build plant-floor dashboards on MQTT data and need them to be reliable and trusted by the operators using them.
Manufacturing dashboards are everywhere, but dashboards that operators actually trust? Those are rare. The difference between a wall-mounted screen that is ignored and a tool that drives real decisions comes down to one thing: context.
Contextualized MQTT data is MQTT telemetry enriched with metadata (unit of measure, data source, timestamp quality, and semantic meaning) so that every value on a dashboard can be traced, filtered, and trusted. This article walks you through building manufacturing dashboards on a foundation of well-modeled, semantically rich MQTT data, from topic design to real-time KPI panels, using HiveMQ as the data streaming backbone and visualization tools like Grafana on top.
If you have ever stared at a temperature reading on a dashboard and wondered, "Is that Celsius or Fahrenheit? Which sensor? Is it current or stale?" then this guide is for you.
Why do most manufacturing dashboards fail to earn trust?
The most common reason plant-floor dashboards get ignored is a bad data foundation. Three patterns show up repeatedly:
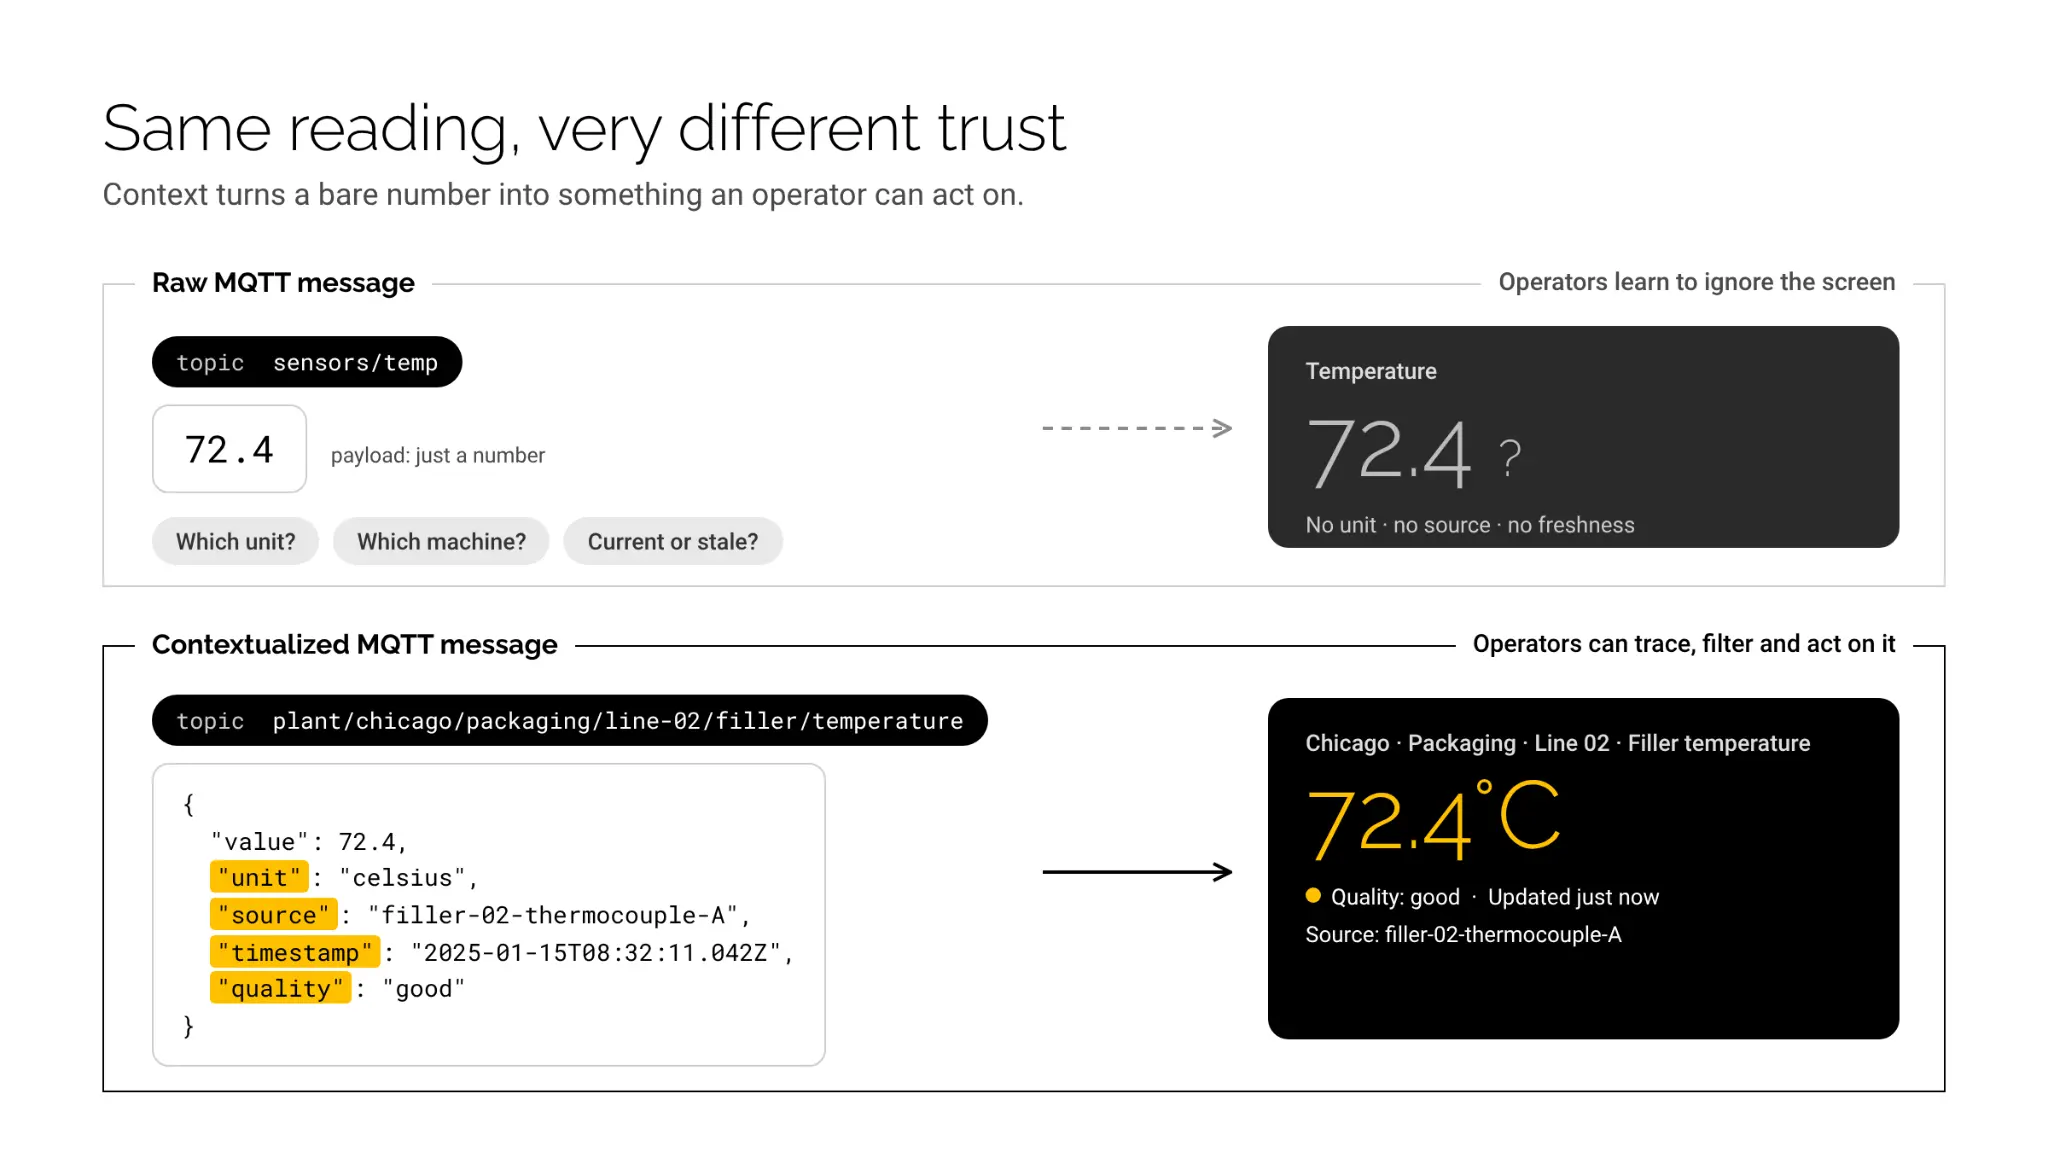
- Missing context. A value of 72.4 arrives on the topic sensors/temp. What unit? Which machine? Which production line? Without context, the number is meaningless. Operators learn to not trust it.
- Stale or duplicated readings. If a sensor publishes on a fixed interval but the dashboard has no way to distinguish "fresh reading" from "retained message from three hours ago," every metric becomes questionable. According to a survey by LNS Research, around 60% of manufacturers cited data quality and trust as the top barrier to scaling analytics initiatives.
- No clear lineage. When a KPI like Overall Equipment Effectiveness (OEE) is displayed, operators need to know: what formula was used, which data sources fed it and when it was last computed. Without data lineage for manufacturing, a single bad OEE number can undermine confidence in the entire system.
The root cause in all three cases is the same: raw MQTT messages were sent to a dashboard without the intermediate step of adding meaning. Data was moved but never turned into information or intelligence.
How to structure MQTT topics for manufacturing dashboards using ISA-95
The structure of your MQTT topic hierarchy directly determines how easy (or painful) it is to build reliable dashboards. A well-designed topic tree acts as a built-in filter and navigation system for visualization tools.
Start with ISA-95 as a guide. ISA-95, the international standard for enterprise-control system integration, defines a hierarchy: Enterprise, Site, Area, Production Line and Work Cell. You do not need to follow it rigidly but it provides a proven skeleton.
Here is an example topic structure for a bottling plant:
plant/chicago/packaging/line-02/filler/temperature
plant/chicago/packaging/line-02/filler/pressure
plant/chicago/packaging/line-02/labeler/speed
plant/chicago/quality/line-02/reject-count
Each topic segment carries meaning:
| Segment | Meaning | Dashboard use |
|---|---|---|
| plant/chicago | Site | Site-level filter |
| packaging | Area | Area drill-down |
| line-02 | Production line | Line-level KPI grouping |
| filler | Equipment / work cell | Equipment detail view |
| temperature | Measurement type | Panel data source |
This structure lets a visualization tool like Grafana use MQTT wildcard subscriptions (plant/chicago/packaging/+/filler/temperature) to pull temperature data across all lines automatically. No custom query logic needed.
Avoid flat topic structures like data/sensor42 or telemetry/12345. These force dashboard builders to maintain a lookup table mapping sensor IDs to physical locations. That lookup table becomes a single point of failure for trust: if it is out of date, every dashboard panel shows data from the wrong source.
For a deeper look at MQTT topic design patterns and enterprise broker configuration, explore HiveMQ's MQTT essentials guides. And, a well-structured MQTT topic hierarchy also forms the foundation of a Unified Namespace (UNS), where data is organized consistently across production systems. For a detailed walkthrough of ISA-95-based topic design, read UNS Semantic Data Hierarchy with MQTT: Explained with an Example.
What context tags should every MQTT payload include?
Topic structure provides location and hierarchy, but the payload itself needs metadata to make each reading fully self-describing. For beginner implementations, five context fields make the biggest difference:
{
"value": 72.4,
"unit": "celsius",
"source": "filler-02-thermocouple-A",
"timestamp": "2025-01-15T08:32:11.042Z",
"quality": "good"
}
Here is what each field does for your dashboard:
- value: The measurement itself. Always use a consistent numeric format (not strings).
- unit: Eliminates the "Celsius or Fahrenheit?" problem. Dashboard panels can auto-label axes and apply conversions.
- source: Identifies the physical sensor or device. Essential for troubleshooting when a reading looks wrong.
- timestamp: The time the reading was taken at the source, not when it arrived at the broker. This distinction matters enormously for accuracy. A message might be delayed by network congestion, but the reading itself happened at a specific moment.
- quality: A flag indicating whether the reading is reliable. OPC UA uses quality codes (Good, Bad, Uncertain) and adopting a similar pattern for MQTT payloads lets dashboards visually flag suspect data instead of displaying it as if it were trustworthy.
The HiveMQ Broker with the platform’s Connect layer handles the reliable transport of these payloads at scale, supporting millions of concurrent connections with clustered high availability. For organizations that want to enforce payload structure (ensuring every message includes unit and quality, for example), HiveMQ Platform provides a policy engine that can validate, transform and reject messages at the broker level before they ever reach a dashboard.
As your deployment matures, HiveMQ Data Intelligence (Contextualize layer) extends this further by adding semantic context: it catalogs what data exists across your entire MQTT namespace, defines what each data stream means through its Semantic Graph and enforces governance policies so that dashboard consumers always know the data's origin, meaning and trustworthiness. As data volumes grow, manufacturers also need to balance rich semantic context with efficient message payloads. For strategies to reduce data volume without losing operational meaning, read Contextual Modeling Strategies to Reduce Manufacturing Data Volume.
How do you build real-time manufacturing KPI panels that operators trust?
Once your MQTT data is well-structured and contextualized, building KPI panels becomes straightforward. Here are three KPIs common in manufacturing, with guidance on getting them right.
1. OEE (overall equipment effectiveness)
OEE is the gold standard manufacturing KPI. It is calculated as:
OEE = Availability × Performance × QualityEach component needs specific data streams:
- Availability: Machine state (running, stopped, changeover). Subscribe to topics like plant/chicago/packaging/line-02/filler/state.
- Performance: Actual cycle time vs. ideal cycle time. Subscribe to plant/chicago/packaging/line-02/filler/speed and compare against a configured ideal rate.
- Quality: Good units vs. total units. Subscribe to plant/chicago/quality/line-02/reject-count and plant/chicago/packaging/line-02/filler/unit-count.
Common pitfall: Calculating OEE from raw sensor data without accounting for planned downtime. If the line was scheduled for a 30-minute changeover but your availability calculation treats it as unplanned downtime, OEE drops artificially and operators lose trust in the number. Context metadata (specifically, a planned_state field from the MES or scheduling system) is essential.
Calculating OEE accurately also requires bringing together machine states, production schedules, and quality data. For a detailed implementation using the HiveMQ Platform, read How to Calculate OEE in a Unified Namespace with the HiveMQ Platform
2. Throughput
Throughput (units per hour) seems simple but gets tricky in real-time visualization. If your dashboard refreshes every 5 seconds but the unit counter only increments every 12 seconds, you get a jagged, misleading chart.
Solution: Use a rolling window calculation (e.g., units produced in the last 60 seconds, extrapolated to per-hour) rather than instantaneous snapshots. Include the timestamp field from the payload to align calculations to source time, not arrival time.
3. Process parameter monitoring
Displaying temperature, pressure, or vibration in real-time is the most common use case. The trust killer here is stale data displayed as current.
Solution: Use the quality field and the timestamp to detect staleness. If a reading is more than 3x the expected publish interval old, display it with a visual warning (gray out the panel, show a "stale" indicator). Grafana supports threshold-based coloring that makes this easy to configure.
For step-by-step integration patterns connecting HiveMQ to Grafana and other analytics tools, see the HiveMQ integrations documentation.
How to avoid the most common misleading metrics in manufacturing analytics
Even with good topic structure and context tags, certain visualization mistakes can erode trust. Here are four to watch for:
1. Averaging across unlike units. If one sensor reports in Celsius and another in Fahrenheit, an average is nonsensical. The unit context field prevents this, but only if your dashboard logic checks it. Build validation into your data pipeline, not just your visualization layer.
2. Displaying aggregated data without sample counts. An "average temperature of 65°C" is very different if it is the average of 1,000 readings vs. 3 readings. Always display the sample count alongside aggregated metrics so operators can judge confidence.
3. Ignoring timezone and clock drift. Industrial sensors often have imprecise clocks. If your dashboard correlates events across machines (e.g., "the filler stopped 2 seconds after the labeler jammed"), clock drift can make the correlation appear backward. Use the broker's arrival timestamp as a secondary reference and flag discrepancies greater than 1 second.
4. Showing raw data where derived data is needed. A vibration reading of 4.2 mm/s is meaningless to most operators. A panel that shows "Vibration: Normal (4.2 mm/s, threshold: 7.0 mm/s)" turns a number into actionable information. This is contextualization in action: adding meaning to measurement.
HiveMQ Contextualize layer’s governance capabilities directly address patterns like these by enforcing data quality rules and semantic consistency at the platform level, so that individual dashboard builders do not need to reinvent these checks for every panel.
What is the path from raw MQTT data to a trusted dashboard?
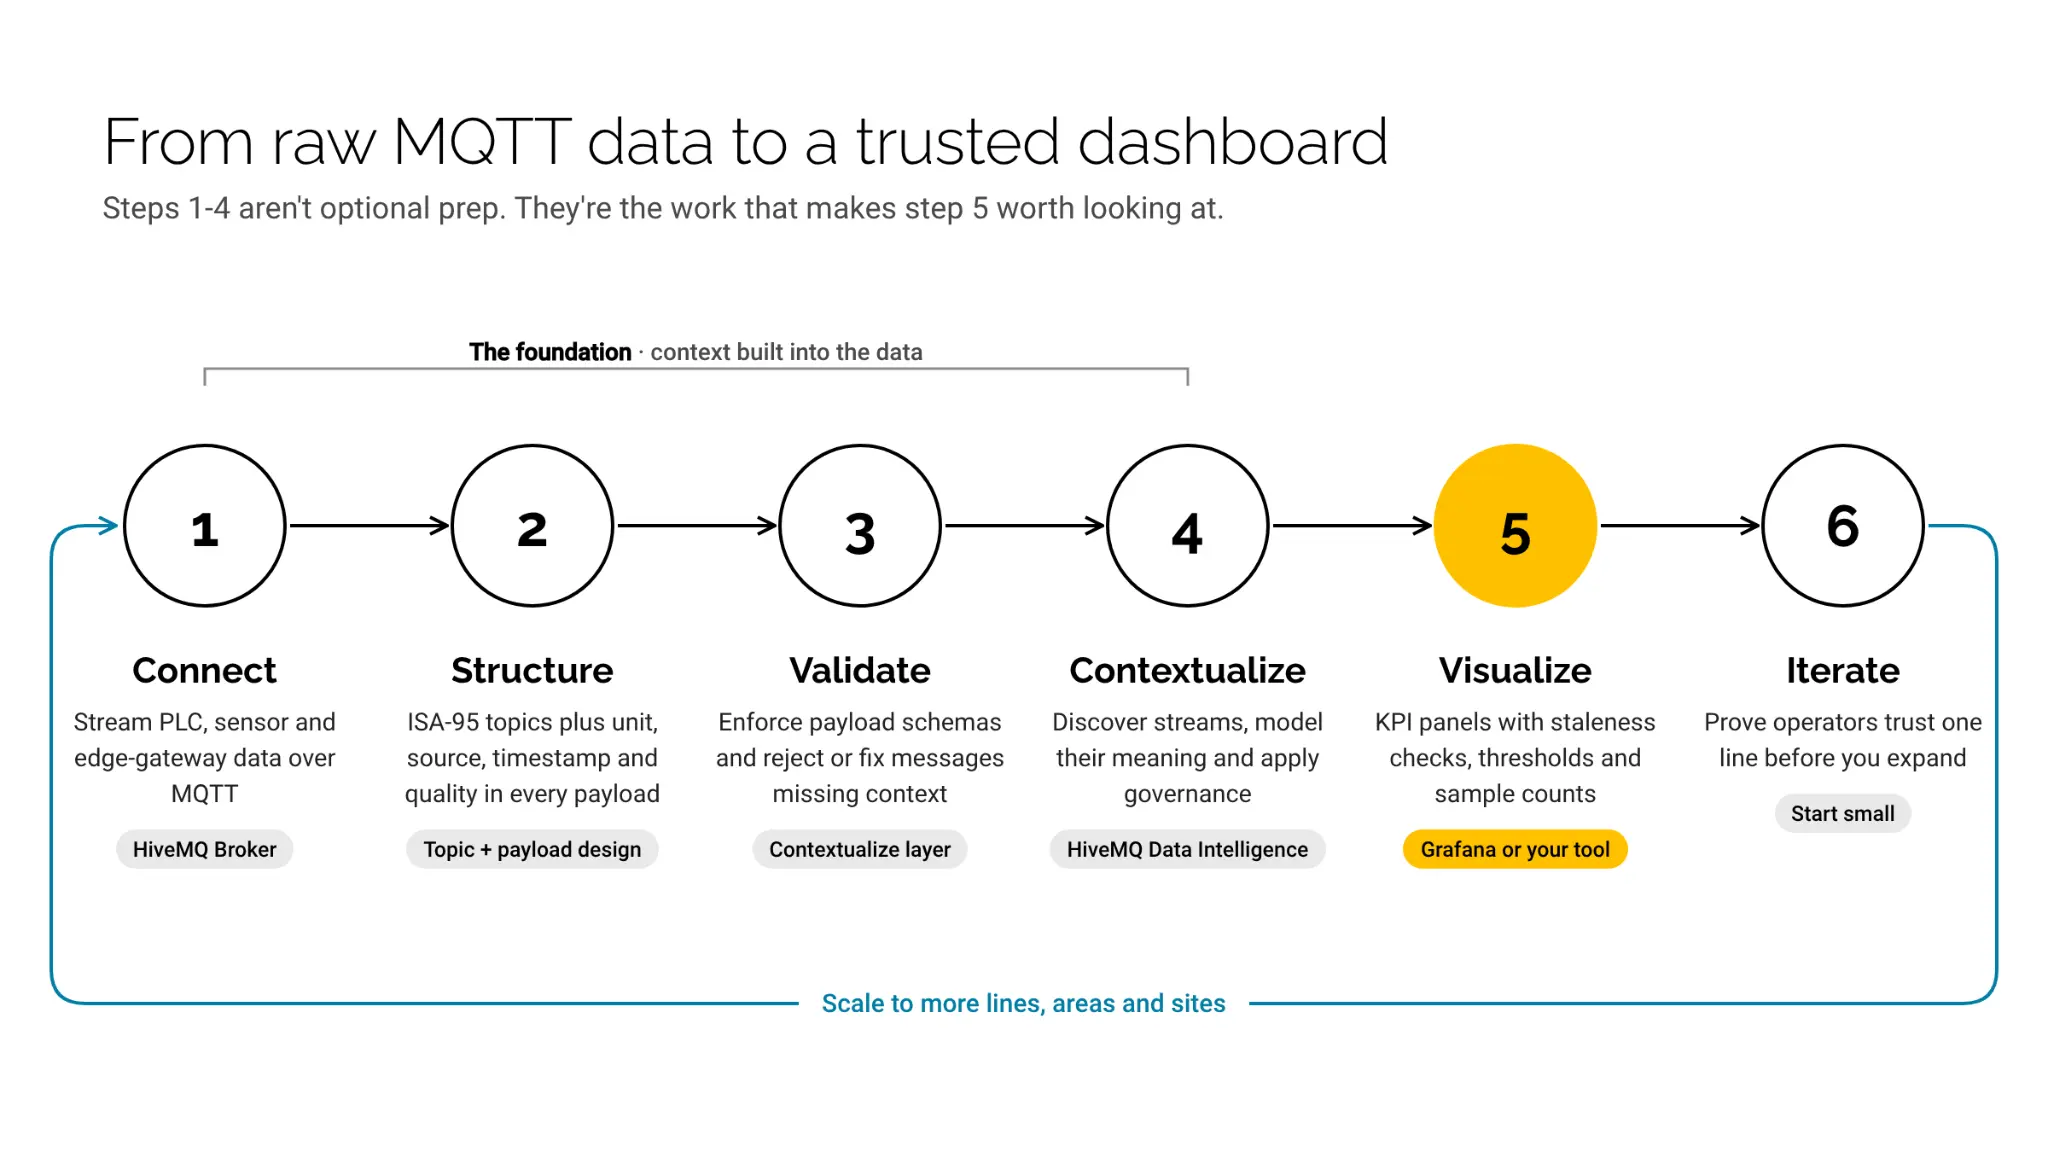
Here is the progression, summarized as a practical roadmap:
- Connect: Deploy HiveMQ Connect (HiveMQ Broker) as your MQTT backbone. Connect your PLCs, sensors, and edge gateways. If devices speak OPC UA, Modbus, or other protocols, use HiveMQ Platform for protocol translation to MQTT.
- Structure: Design your MQTT topic hierarchy around your physical plant layout using ISA-95 as a guide. Include context metadata (unit, source, timestamp, quality) in every payload.
- Validate: Use HiveMQ Platform’s Contextualize layer to enforce payload schemas at the broker. Reject or transform messages that are missing required context fields.
- Contextualize: As your deployment matures, use HiveMQ Data Intelligence to discover all data streams, model their semantic meaning in the Semantic Graph, and apply governance policies.
- Visualize: Connect Grafana (or your preferred tool) to the broker. Build KPI panels that leverage the context you have built into the data. Add staleness detection, threshold coloring, and sample count indicators.
- Iterate: Start with one production line. Prove that operators trust the dashboard. Then scale to additional lines, areas, and sites.
The key insight is that steps 1 through 4 are not optional preparation; they are the work that makes step 5 actually valuable. A dashboard without contextualized data is a liability. A dashboard built on well-governed, semantically rich MQTT data is a decision-making tool.
Ready to build your first trustworthy manufacturing dashboard? Get started with HiveMQ Platform and connect your first production line in minutes, or explore the documentation for detailed integration guides with Grafana and other visualization tools.