Control Center Analytics
The HiveMQ Control Center offers a wide array of analytics functionality. While we do not recommend substituting an operation ready monitoring set up, these analytics can be helpful to get insights to your HiveMQ deployment without the need for any extra efforts.
| Check out our collection of official, off-the-shelf HiveMQ Monitoring Extensions |
Dropped Messages
This site enables you to analyse dropped messages. A dropped message is a message which is not published by the broker due to reasons explained below.
The following aspects can be analysed:
-
The reasons why messages were dropped. This is explained in the Dropped messages by reason chapter.
-
The clients for which messages have been dropped. This is explained in the Clients with dropped messages chapter.
-
The shared subscription groups for which messages have been dropped. This is explained in the Shared subscription groups with dropped messages chapter.
| Detailed information on the reasons for dropped messages is given at the end of this section. |
Dropped Messages by Reason
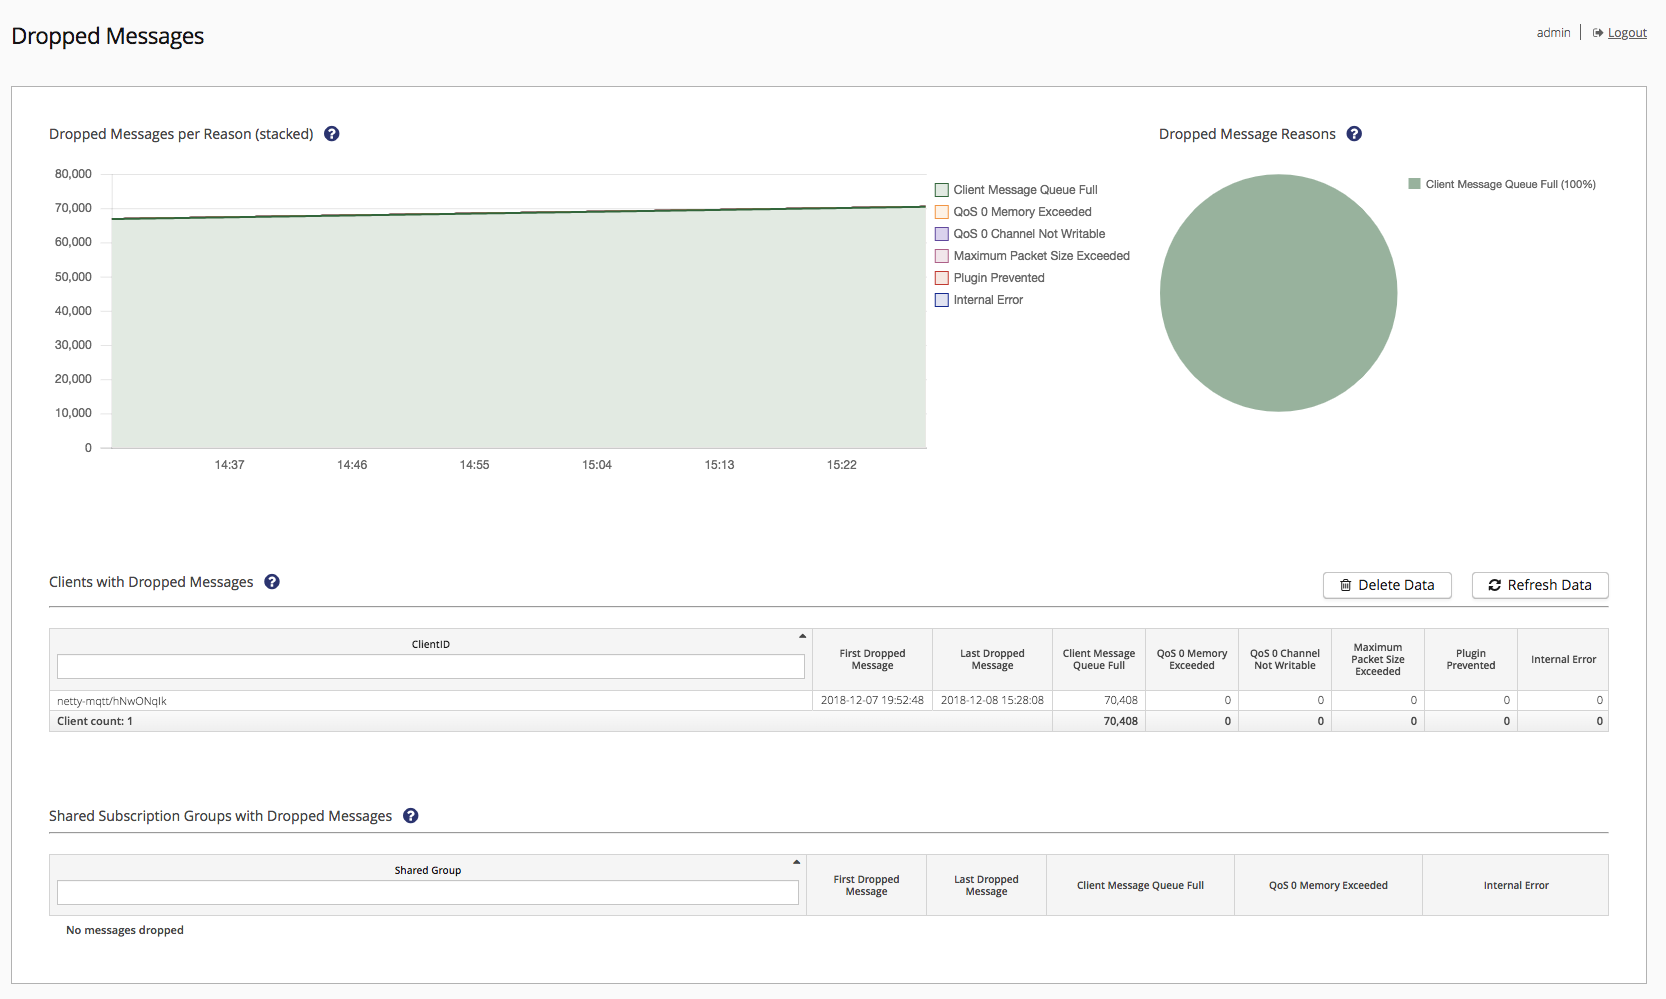
The reasons why messages were dropped are visualized on the top of the page.
The left diagram visualizes the count of dropped messages over the last hour grouped by the reason.
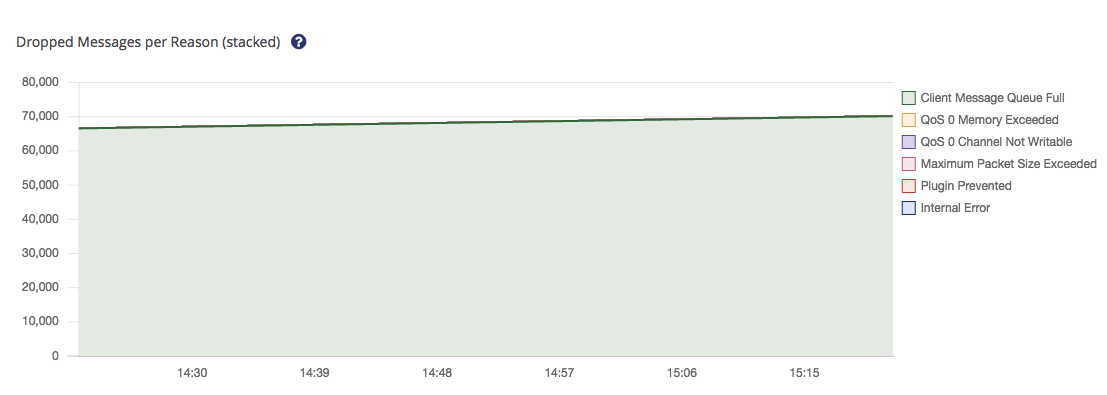
You can select or deselect specific reasons by clicking on them in the legend of the diagram. The diagram is updated every 10 seconds.
The right pie chart visualizes the total count and the percentage of every reason.
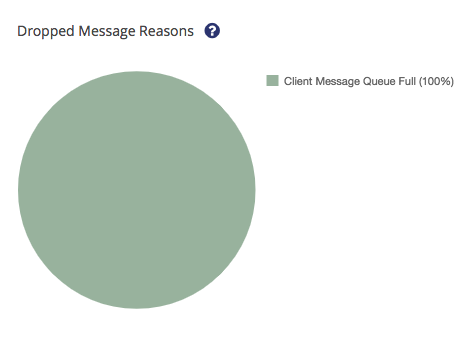
You can select or deselect specific reasons by clicking on them in the legend of the chart.
Message are dropped because of the following reasons:
| Reason | Description |
|---|---|
Client’s message queue was full as another message for that client arrived. |
|
Broker wide memory for queueing Quality of Service 0 messages has been exceeded. |
|
Quality of Service 0 could not be delivered because it was impossible to write to the client socket |
|
Message size was bigger than the maximum size of the receiving client |
|
Message deliver got prevented by a Publish Inbound Interceptor |
|
Messages that were dropped because of internal errors. |
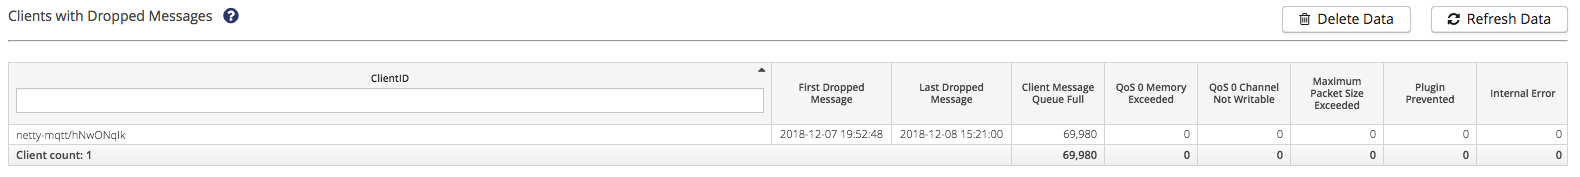
Dropped Messages by Client
This table contains the first 100 clients per Node that dropped messages in the last four days:
| Column | Descriptions |
|---|---|
ClientID |
The ID of the Client that dropped messages |
First Dropped Message |
The timestamp of the first message the Client dropped |
Last Dropped Message |
The timestamp of the last message the Client dropped |
Client’s message queue was full as another message for that client arrived. |
|
Broker wide memory for queueing Quality of Service 0 messages has been exceeded. |
|
Quality of Service 0 could not be delivered because it was impossible to write to the client socket |
|
Message size was bigger than the maximum size of the receiving client |
|
Message deliver got prevented by a Publish Inbound Interceptor |
|
Messages that were dropped because of internal errors. |
Each column can be ordered ascending or descending. Filtering is available for ClientID, using a "startsWith" comparison.
By clicking on a Client you can navigate to the Client Detail View.
Furthermore you can clear all data stored with the Clear Data - button located on right side above the table.
Additionally there is the possibility to refresh the data by pressing the Refresh Data - button
Dropped Messages by Shared Subscription Groups
This table represents information about Shared Groups which dropped messages during the last four days. The maximum number of Shared Groups displayed is limited to 100

| Column | Descriptions |
|---|---|
Shared Group |
The ID of the Client that dropped messages |
First Dropped Message |
The timestamp of the first message the Client dropped |
Last Dropped Message |
The timestamp of the last message the Client dropped |
Client’s message queue was full as another message for that client arrived. |
|
Broker wide memory for queueing Quality of Service 0 messages has been exceeded. |
|
Messages that were dropped because of internal errors. |
Detailed explanation of the reasons
The core function of the HiveMQ broker in any MQTT deployment is delivering messages.
For most use cases this message delivery needs to be as reliable as possible and the dropping of messages is not a
desired outcome.
This does not mean that every dropped message automatically represents a problem. The HiveMQ Control Center offers an
in-depth look into why messages got dropped and who the messages got dropped for.
The following lists explanations for each possible cause of dropped messages as well as some insight towards
interpreting them and leveraging this information for debugging purposes.
Client Message Queue Full
Every client has a queue in which messages for the client. Queueing either occurs when the client uses persistent
sessions and is offline or when the client is not consuming messages in the same speed as it is receiving messages.
When this queue is full, the newest or oldest messages get dropped, dependent on the queuing strategy.
Observing a high number of this kind of dropped messages may indicate that your clients are consuming messages too slow
or that their connection is very unstable.
QoS 0 Memory Exceeded
When messages with Qualify of Service 0 is received the broker puts the message into a global in-memory queue.
In case the size of that QoS=0 queue exceeds a global memory limit, additional incoming QoS=0 messages get dropped.
Observing a high number of this kind of dropped messages may indicate that your clients are consuming messages too slow
or that their connection is very unstable.
QoS 0 Channel Not Writable
When a Messages with QoS 0 is received by the broker and the socket of the intended receiving client could not be
written on, the message is dropped with this reason.
This is caused by a client not being able to read fast enough to keep up with the incoming messages.
Maximum Packet Size Exceeded
MQTT 5 allows the a client side setting for maximum packet size of messages received. When a message is larger than its
receiving clients maximum size setting it get dropped with this message.
A large number of this kind of dropped messages indicates that the coordination between sending and receiving clients
is not optimal.
Extension Prevented
The Publish Inbound Interceptor allows users to prevent
onward delivery of messages. In this case the broker drops the message with this reason
When best practises for extension development are upheld the reason for the delivery prevention will be logged and or
forwarded to the client.
Internal Error
If an internal error occurs during handling a message, the message gets dropped.
The reason for the internal error is not specified.
Messages dropped for this reason are a clear warning sign for some underlying unexpected problem.
Check your HiveMQ log for the referenced Error and contact the HiveMQ Support, if you
observe this.
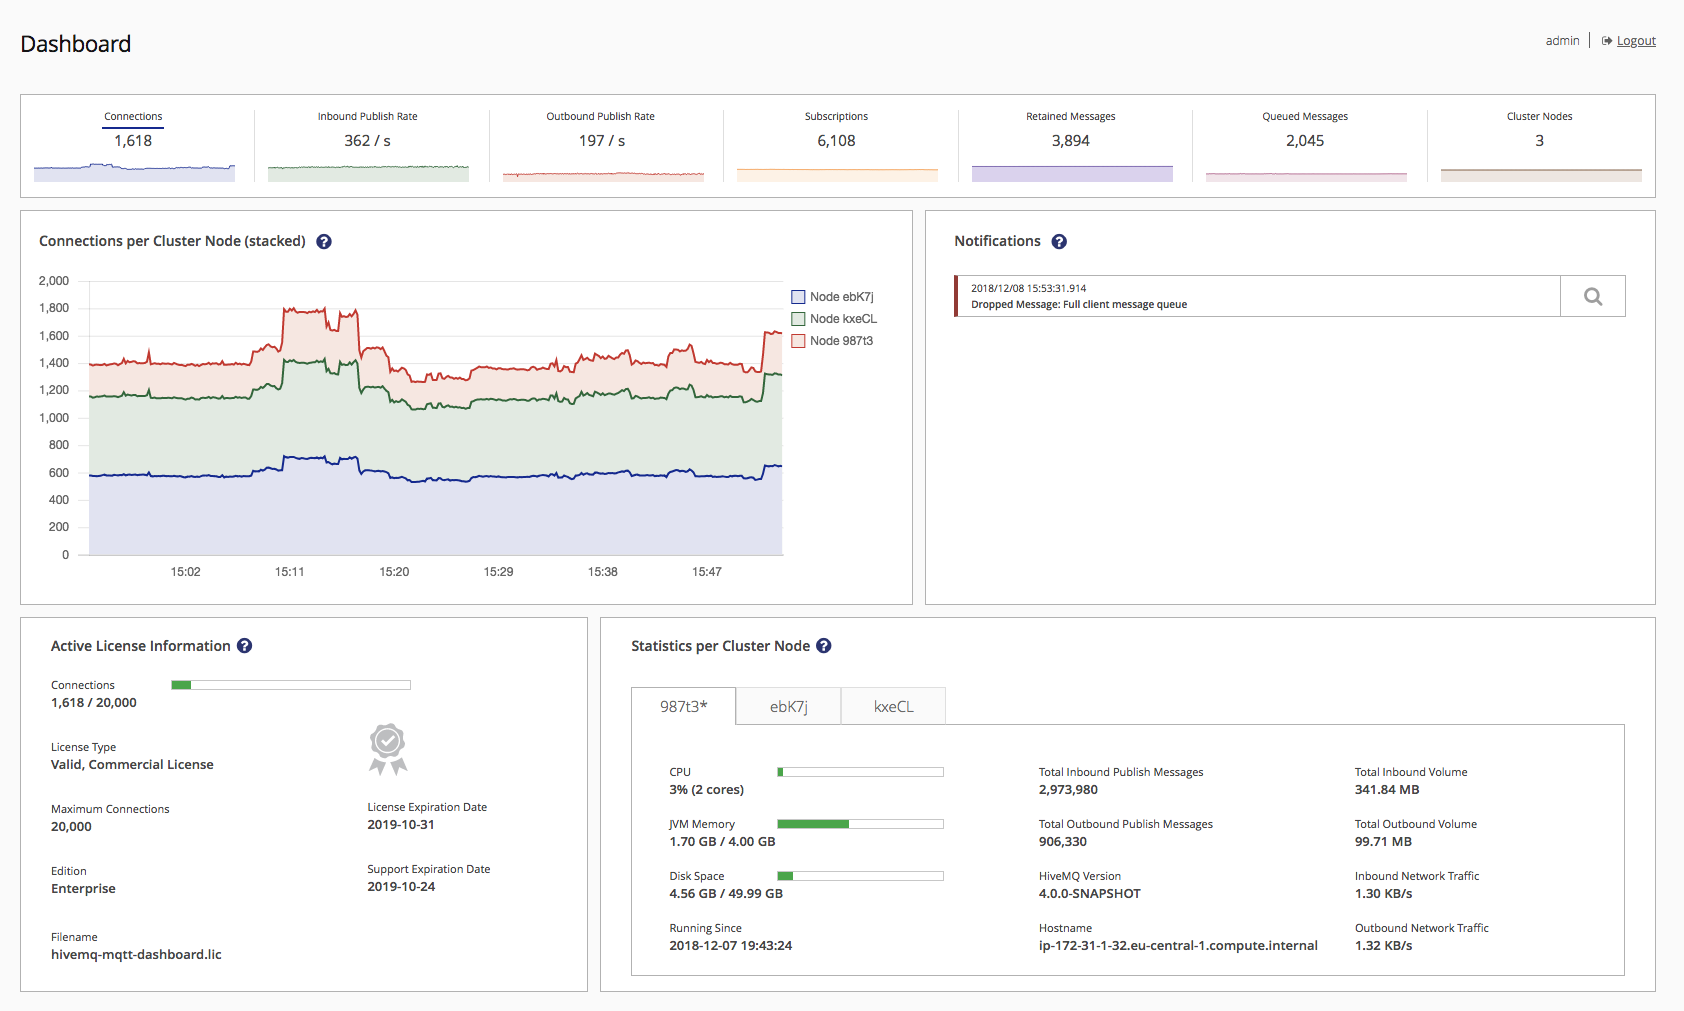
Cluster metrics
This section is designed provide a quick overview and some context on the available cluster metrics of the HiveMQ Control Center dashboard.
The following metrics are displayed on the dashboard:

| Metric | Description |
|---|---|
Connections |
Current amount of active connections on all nodes |
Inbound Publish Rate |
Current amount of incoming Publishes per second over all cluster nodes |
Outbound Publish Rate |
Current amount of outgoing Publishes per second over all cluster nodes |
Subscriptions |
Current amount of Subscriptions and replicas stored in the cluster |
Retained Messages |
Current amount of Retained Messages and replicas stored in the cluster |
Queued Messages |
Current amount of Queued Messages and replicas stored in the cluster (may show Queued Messages of already disconnected clean session clients) |
Cluster Nodes |
Current amount of Cluster Nodes |
For more information on clustering, please visit our clustering benefits blog post.
Detailed Metric View
Each of the available metrics is clickable. Clicking on one of the metrics will provide a more detailed visualization of the metric, which is split by node.
It is possible to choose any metric of the top section like inbound publish rate:
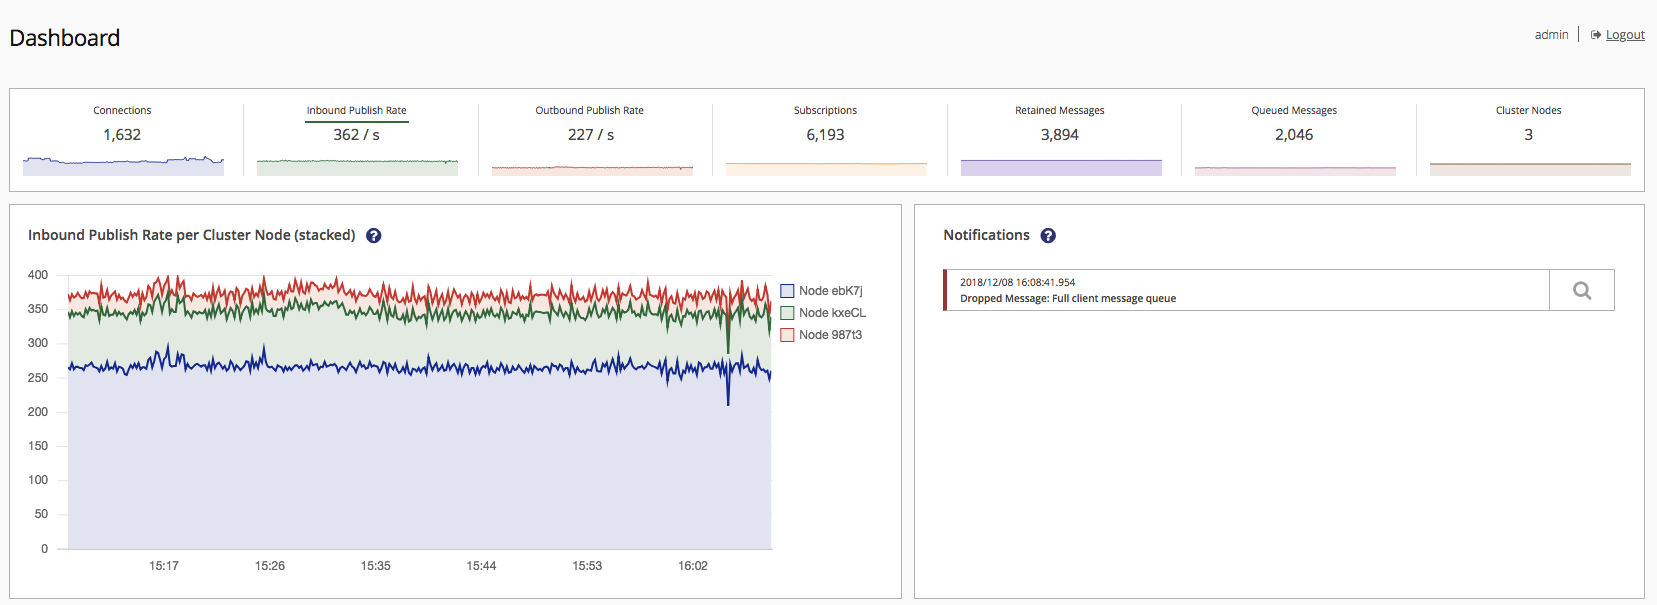
The chosen metric is underlined in the top section.
You can toggle the graphs of individual nodes by clicking the respective buttons on the right legend of the graph.
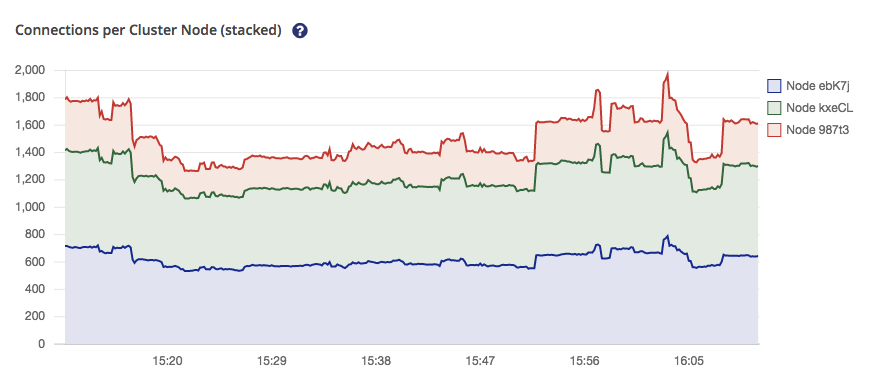
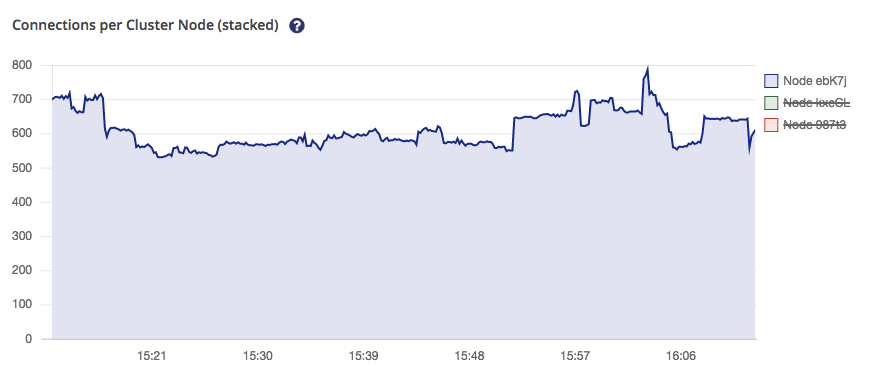
| If you compare both diagrams you will notice that the scale changes automatically. |
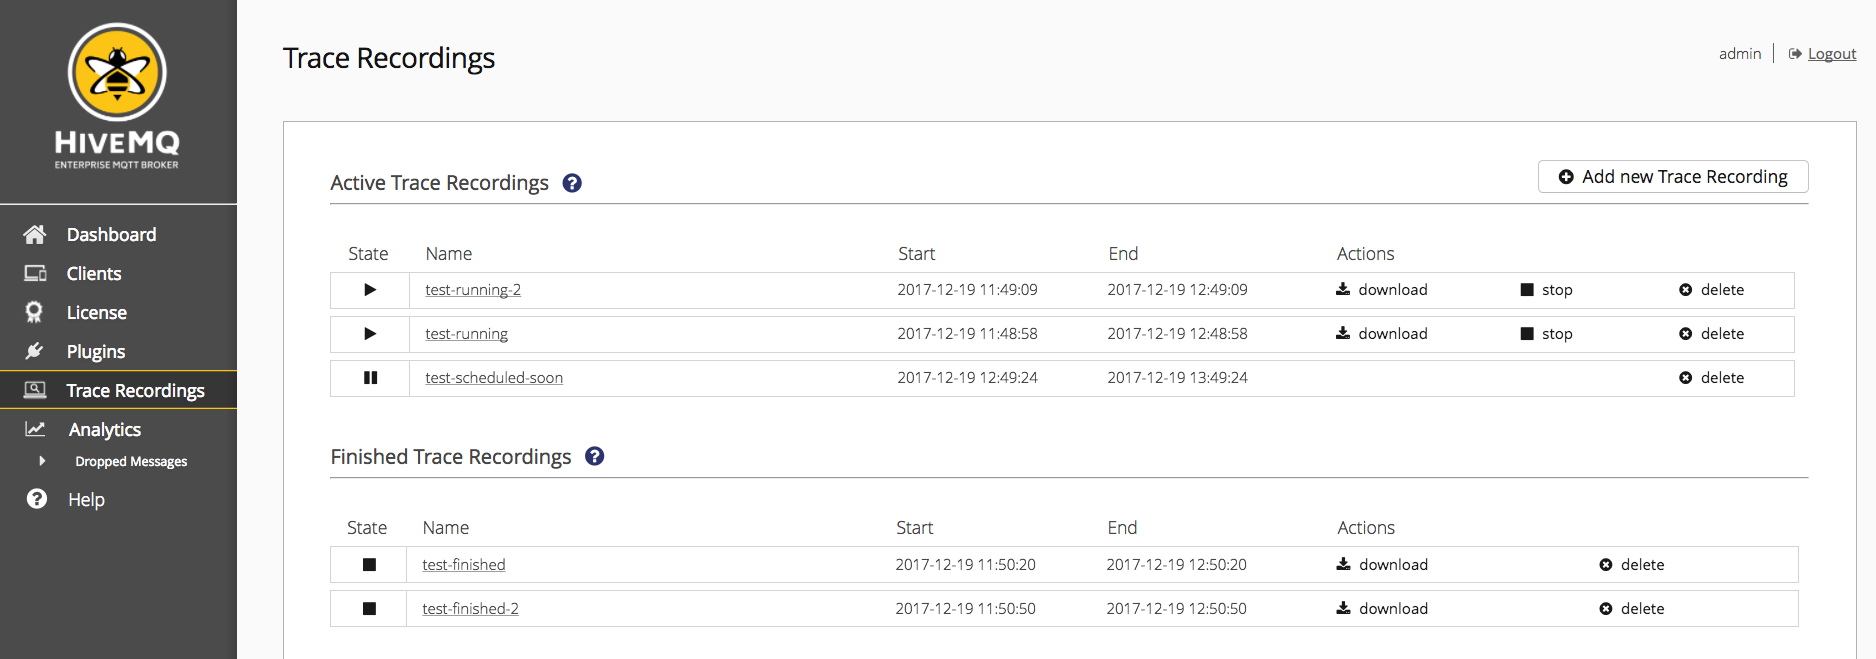
Trace Recordings
Usually a MQTT broker sends and receives millions of MQTT messages during a small period of time. To find out what is really happening with a client or on a topic by analysing all information from the broker is very time-consuming. For an easier approach in doing this, HiveMQ provides the ability to write log files for clients and topics.
A Trace Recording is a combination of filters which allows you to select messages of specific clients or topics, which are logged to a file in a human readable format. Each trace recording creates a .trace file in your HiveMQ log/recordings folder. Trace recordings are created cluster-wide and every HiveMQ cluster node writes its own trace files in its own log folder.
You can log any MQTT message sent or received by the broker with a filter you apply. A Filter can either be a client identifier or a topic. Many filter combinations are possible. All filters are regular expressions.
To add a trace recording click the  button in the right upper corner. More information on adding a trace is given at the
<<trace-recording-new, Add new Trace Recording part.
button in the right upper corner. More information on adding a trace is given at the
<<trace-recording-new, Add new Trace Recording part.
| The trace recording log files are stored as trace-recording-name.trace in hivemq/log/recordings. |
There are four attributes, which define a trace recording explained in the table below.
| Attribute | Description |
|---|---|
State |
Running |
Name |
The Name of the trace recording log file |
Start |
The start date, when HiveMQ begins to record messages for a trace recording |
End |
The end date, when HiveMQ stops to record messages for a trace recording |
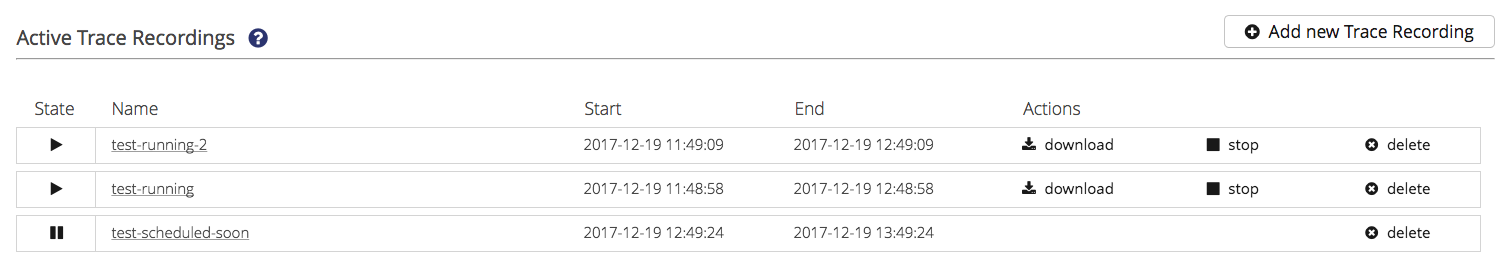
See Active Trace Recordings
Active trace recordings are all trace recordings in the state
'Running'  or 'Waiting'
Active trace recordings can be viewed, downloaded, stopped and deleted.
View a trace recording by clicking on its name. For more detail, have a look here: Trace Recording Details
Download a trace recording by clicking ⇒  .
For more detail, have a look here: Download
.
For more detail, have a look here: Download
Stop a trace recording by clicking ⇒ 
| A stopped trace recording is still available in your HiveMQ log/recordings folder and in the Finished Trace Recordings table, but cannot be started again. |
Delete a trace recording by clicking ⇒ 
| A deleted trace recording is not visible anymore. All its log files are deleted from disk. |
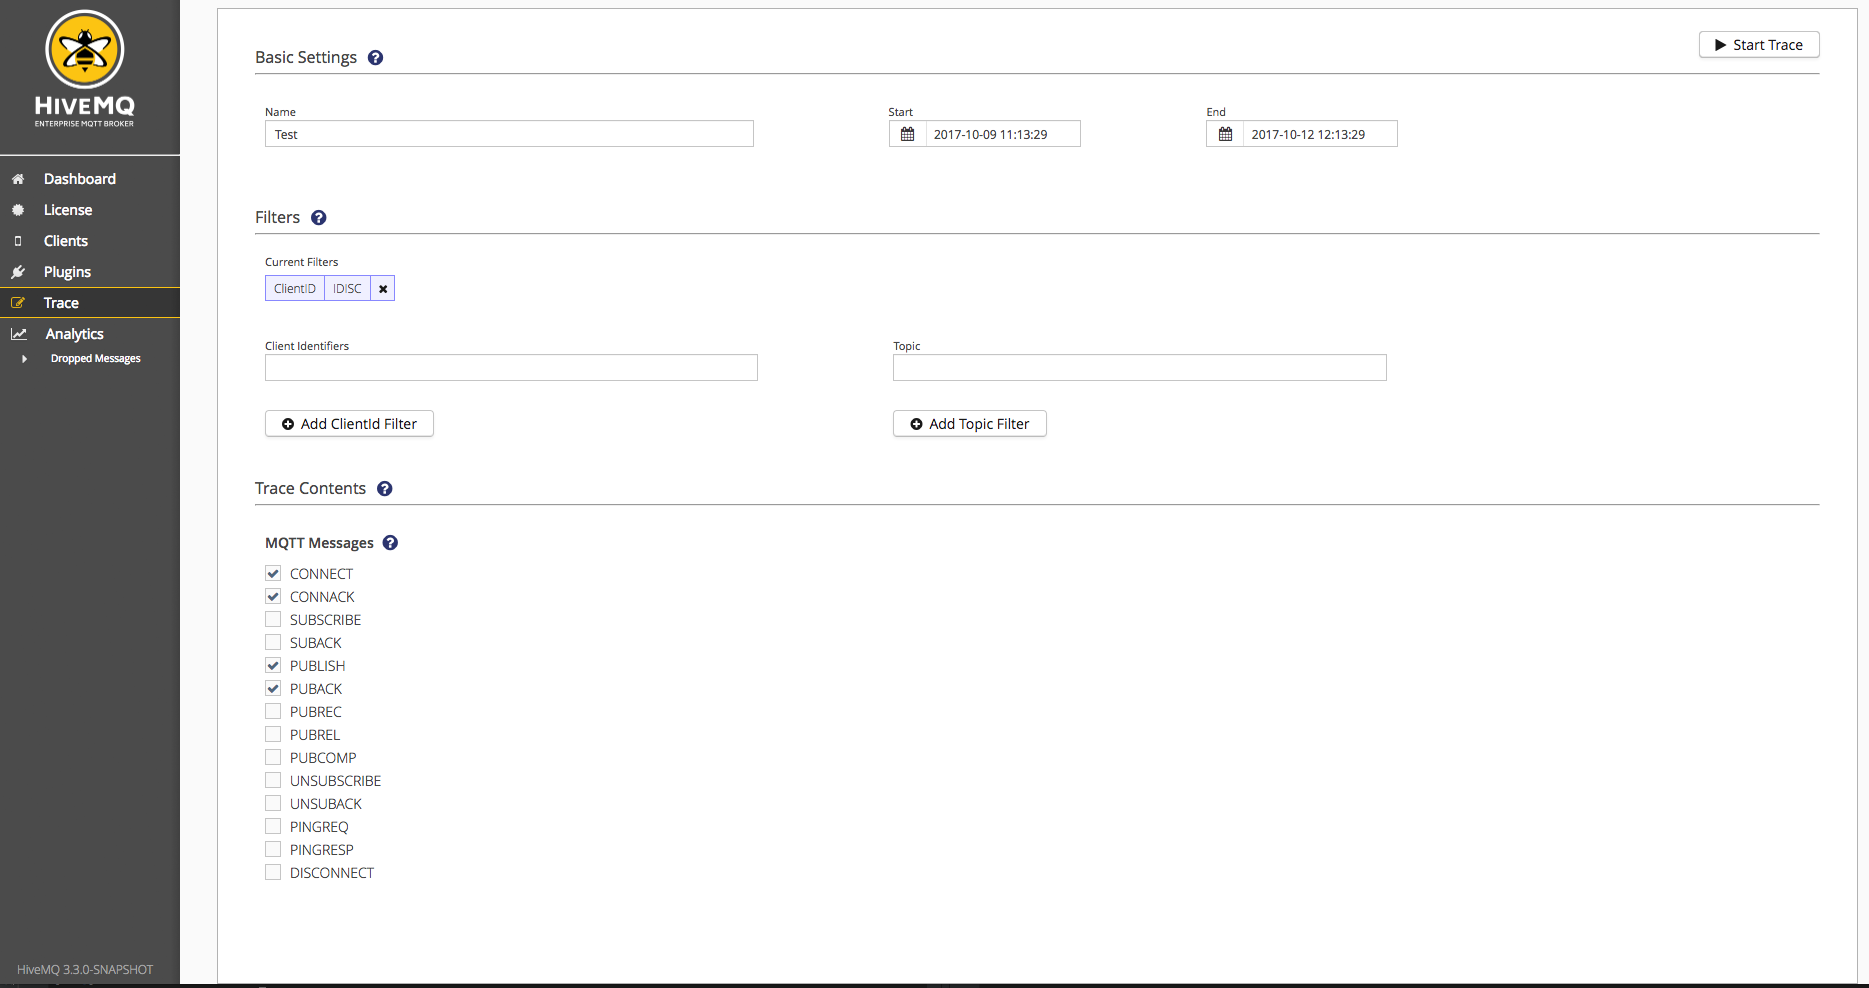
Add new Trace Recording
To add a new trace recording to your HiveMQ click the
button in the right upper corner of the Trace Recordings page.
The following information needs to be specified Basic Settings, Filters
and MQTT Packets
At the top right corner is either a  button
or a
button
or a  button.
When the start date is in the future, the trace recording will be scheduled. When the start date is now or in the past,
the trace recording is started instantly.
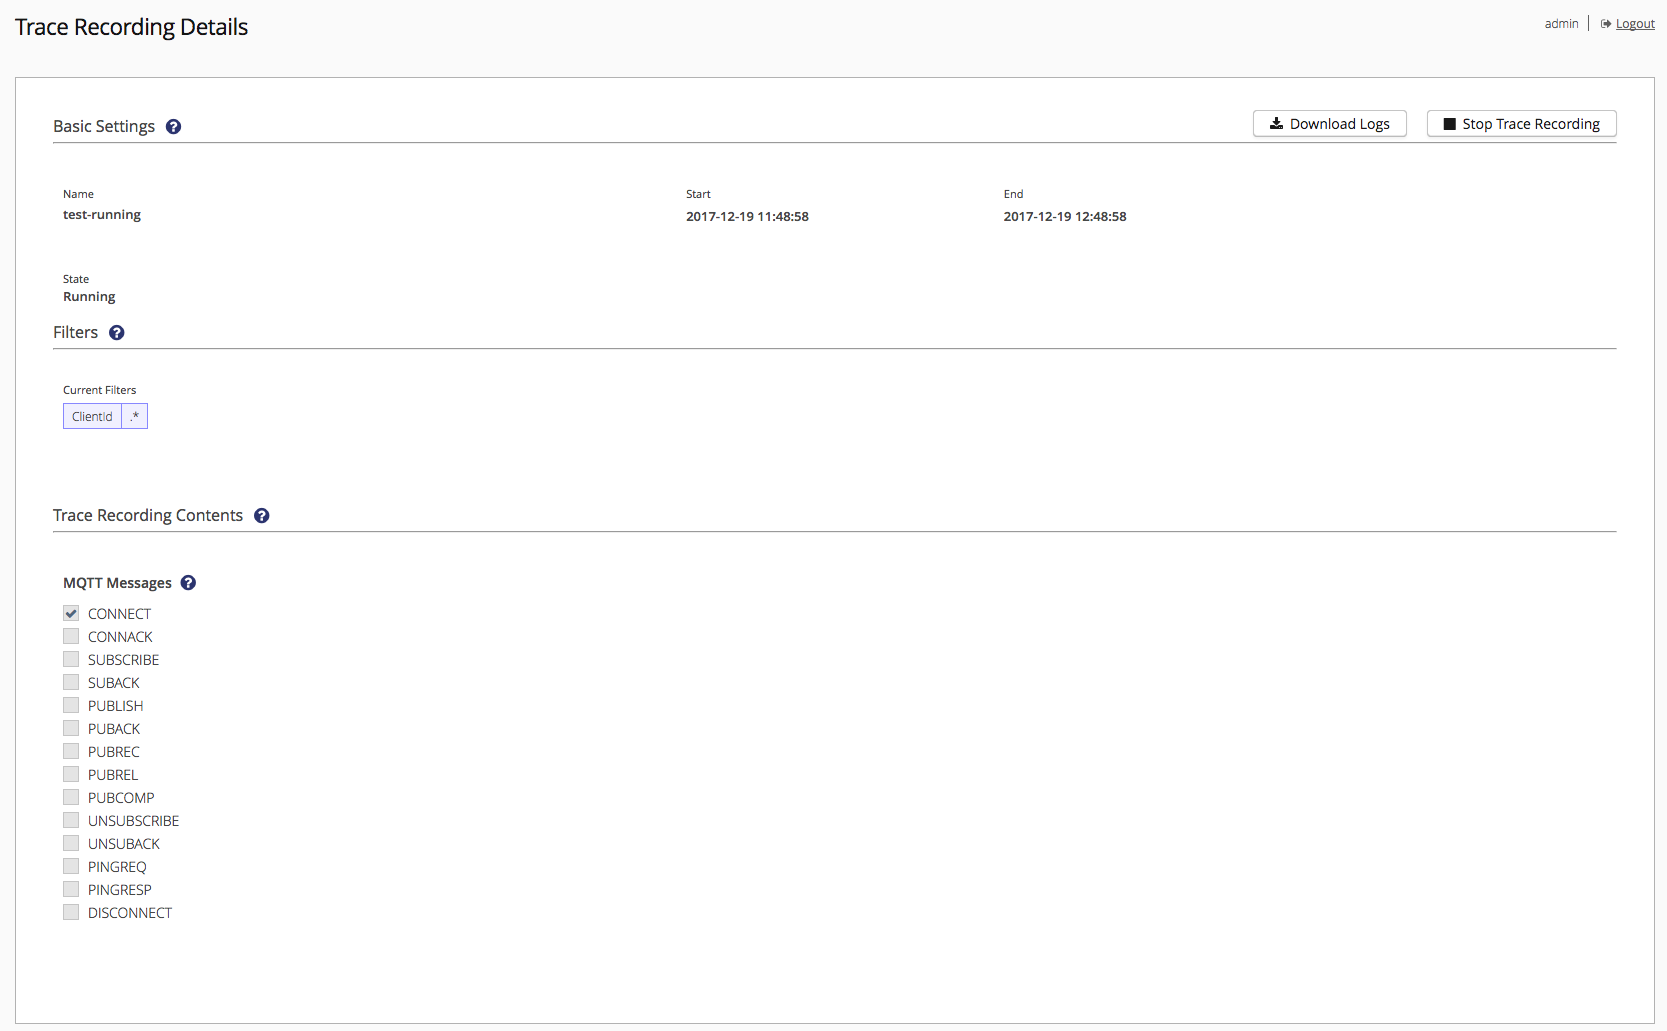
Trace Recording Details
If you clicked on the name of a trace recording, you will be redirected to 'Trace Recording Details',
where you can see the sections 'Basic Settings', 'Filters' and 'Trace Recording Contents'. All information is read only.
For more detail about the sections see Add new Trace Recording
Stop a trace recording by clicking ⇒ 
Download a trace recording by clicking ⇒  .
For more detail, have a look here: Download
.
For more detail, have a look here: Download
| A stopped trace recording is still available in your HiveMQ log/recordings folder and in the Finished Trace Recordings table, but cannot be started again. |
Basic Settings
All fields in 'Basic Settings' are required. If any field failed to validate, you get a red warning message below the corresponding input field.
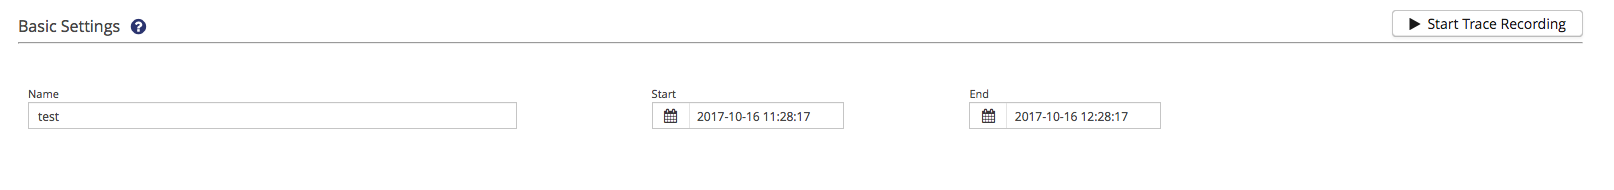
Name
The name defines the filename of the .trace log file in your HiveMQ log/recordings folder. It must be unique, contain
at least three characters and only combinations of numbers, letters, dashes and underscores are allowed.
E.g. 'publishing-clients', 'subscribe_my_topic_1' etc.
Start
When the start date is now or in the past, HiveMQ will start recording log messages immediately after successfully
creation of the trace recording.
When the start date is in the future, HiveMQ will schedule the trace recording. The default value is now.
It must be before the end date and must have this format: yyyy-MM-dd HH:mm:ss
E.g. 2017-10-18 19:42:00
If the start date is after the end date, you can either change the end date or the start date to make the date fields valid.
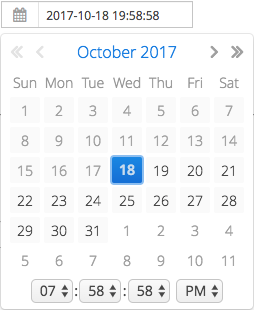
You can type date and time into the input field or click on the calender icon to choose date and time per mouse. See below.
End
The end date determines when HiveMQ stops the trace recording. The default value is now plus one hour.
The end date must be in the future and after start date. It must have this format: yyyy-MM-dd HH:mm:ss
E.g. 2017-10-18 20:42:00
If the end date is before start date, you can either change the end date or the start date to make the date fields valid.
You can type date and time into the input field or click on the calender icon to choose date and time per mouse. See below.
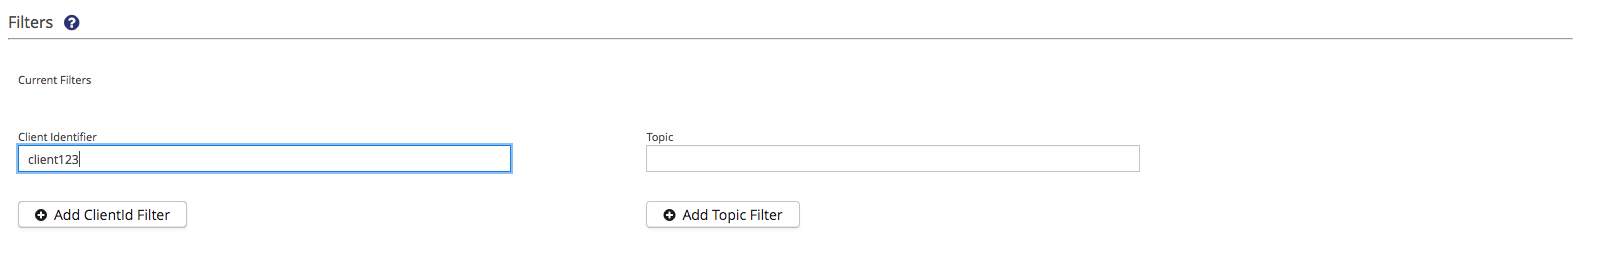
Filters
At the filters section, you can add Client Identifier and Topic filters to the trace recording. At least one filter (ClientID or Topic) must be set. Filters are based on regular expressions.
| For more information about regular expressions please look here. |
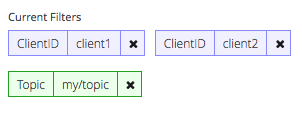
You can set and combine as many ClientID and Topic filters as you want. Contents are recorded, if at least one filter of each category matches. For example, if you set two ClientID filters 'client1' and 'client2' and one Topic filter 'my/topic' all chosen contents will be recorded for 'client1' and 'my/topic' as well as for 'client2' and 'my/topic'.
| Filter | Instructions |
|---|---|
Client Identifier: |
To add a Client Identifier filter, just type a regular expression into the field below and then press Enter or click the Add ClientID Filter Button |
Topic: |
To add a Topic filter, just type a regular expression into the field below and then press Enter or click the Add Topic Filter Button |
To remove a filter click on "x" of the filter you want to remove.
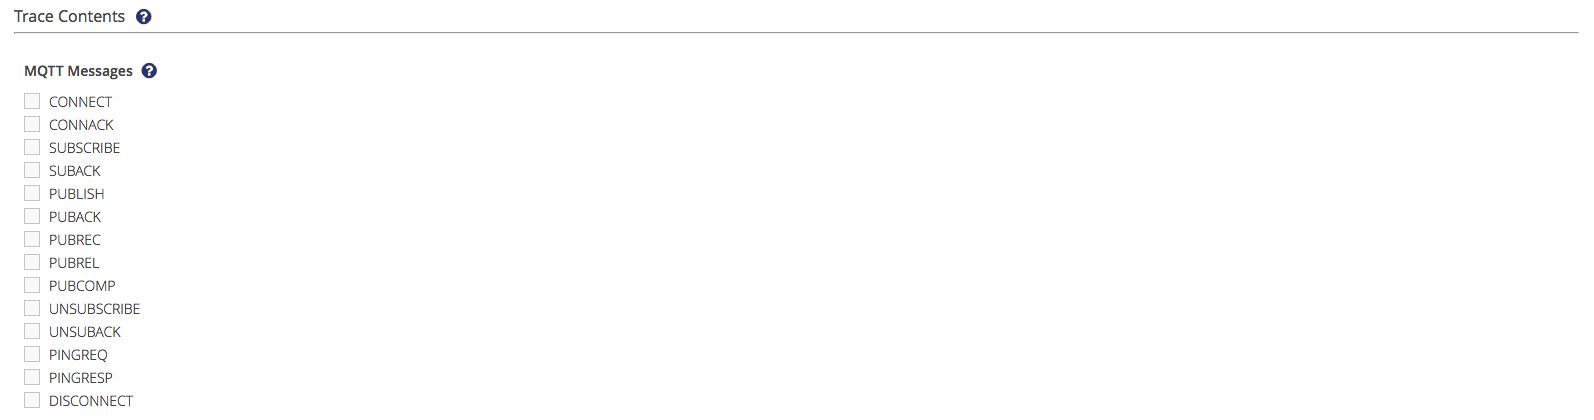
MQTT Packet Selection
In this section you can choose what kind of MQTT messages should be traced. MQTT Messages are messages sent or received by MQTT clients and MQTT brokers You can select the following MQTT Message types to be logged. At least one message type must be selected:
| Client filters can be used to filter any kind of MQTT message, while topic filters apply only for MQTT messages which contain a topic. These are PUBLISH, SUBSCRIBE and UNSUBSCRIBE. |
| Content | Description |
|---|---|
|
A CONNECT message is sent to the broker, when a client connects to a broker |
|
A CONNACK message is sent to the client, when a broker acknowledges the connection of a client |
|
A SUBSCRIBE message is sent to the broker, when a client subscribes to a topic |
|
A SUBACK message is sent to the client, when a broker acknowledges the subscription of a clien |
|
A PUBLISH Message is sent to the broker, when a client publishes to a topic |
|
A PUBACK message is sent to the client, when a broker receives a PUBLISH with QoS 1 |
|
If a broker gets a QoS 2 PUBLISH it will process the publish message accordingly and acknowledge it to the sender with a PUBREC message |
|
If the client receives the PUBREC it can safely discard the initial publish, because it knows that the counter part has successfully received the message. It will store the PUBREC and respond with a PUBREL Message |
|
If the broker gets the PUBREL it can discard every stored state and answer with a PUBCOMP. The same is true when the sender receives the PUBCOMP. |
|
An UNSUBSCRIBE message is sent to the broker, when a client wants to remove a subscription from a topic |
|
A broker will acknowledge the request to unsubscribe with the UNSUBACK message. |
|
A PINGREQ is sent by the client and indicates to the broker that the client is still alive. |
|
When receiving a PINGREQ the broker must reply with a PINGRESP packet to indicate its availability to the client. |
|
A DISCONNECT message is sent to the broker, when a client disconnects from a broker |
| To learn more about the MQTT Message types, have a look at our MQTT Essentials |
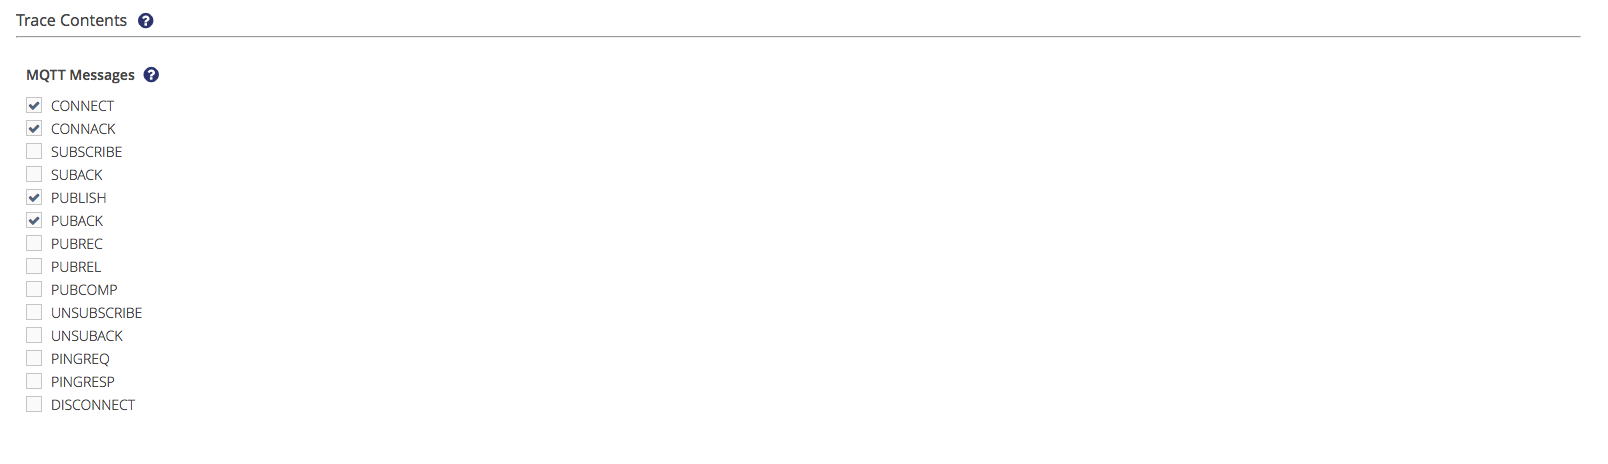
A sample configuration might look like:
Finish Trace Recording Creation
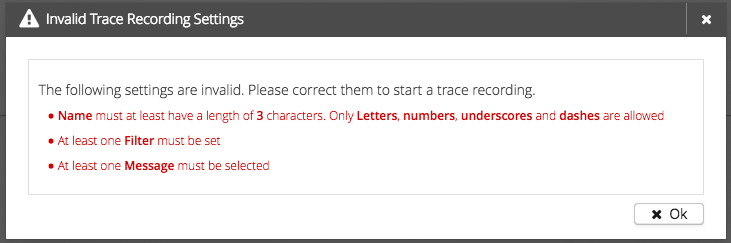
After you configured the trace recording you can press the "Start/Schedule Trace Recording" button in the top right corner. In case you configured something wrong, a notification with the invalid settings is displayed:
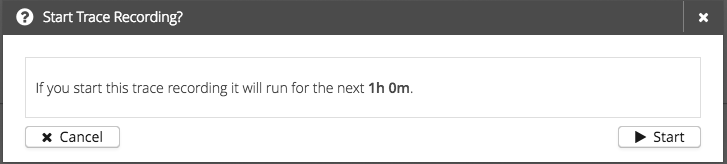
If everything is configured correctly, a confirmation with a duration will be displayed. You can stop the process by clicking "Cancel". To confirm the trace recording press "Start/Schedule" and the trace recording will be added to HiveMQ and you will be redirected to Trace Recordings.
| The trace recording log file is located in HiveMQs log/recording folder. |
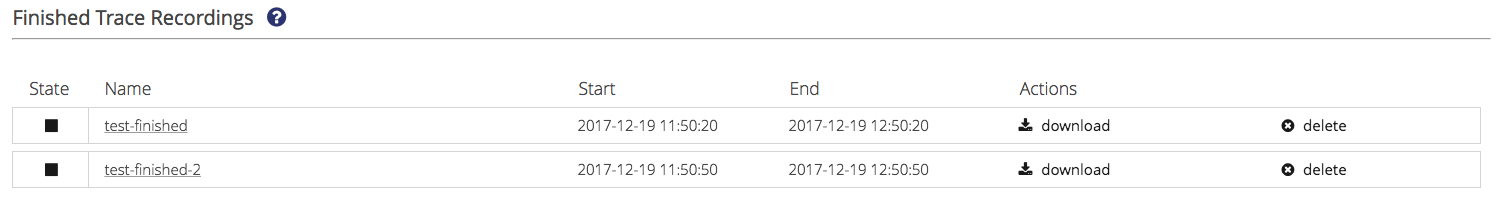
Finished Trace Recordings
Finished trace recordings are all trace recordings in the state
'Stopped'  or 'Aborted'
Finished trace recordings can be viewed and deleted.
View a trace recording by clicking on its name. For more detail, have a look here: Trace Recording Details
Download a trace recording by clicking ⇒ .
For more detail, have a look here: Download
Delete a trace recording by clicking ⇒
| A deleted trace recording is not visible anymore. All its log files are deleted from disk. |
Download finished trace recordings
Every running, stopped and aborted trace recording can be downloaded as a zip file.
This zip file contains a folder per node with every requested trace recording file.
To download a trace recording click ⇒
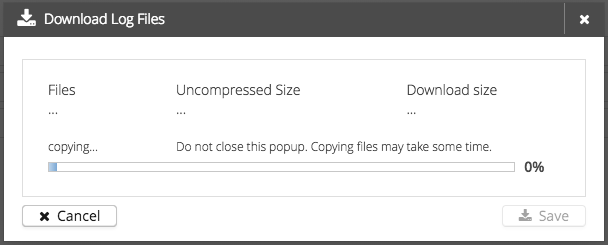
The download will then be prepared in a few steps:
-
When the trace recording is in running state, all trace files will be copied into a temporary folder.
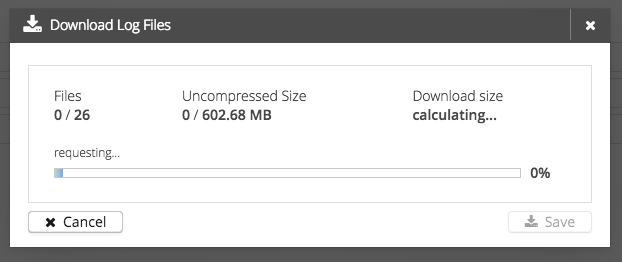
-
All trace recording files from every cluster node will be requested and temporarily stored. ( Progress from 0% - 50% )
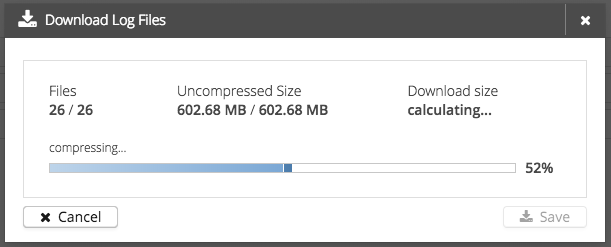
-
A zip file will be created. ( Progress from 50% - 100% )
-
Temporary files will be deleted. ( Progress not visible )
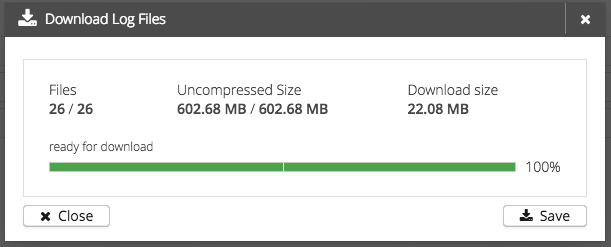
During every step you can cancel the download by clicking the cancel button. When the download is ready you can save the zip file to your local file system or just close the window.
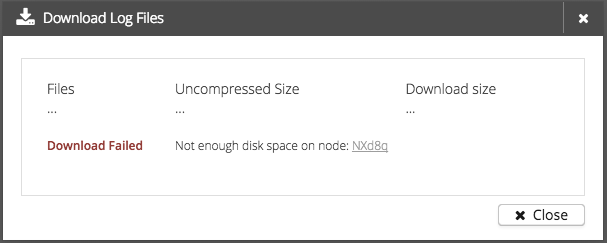
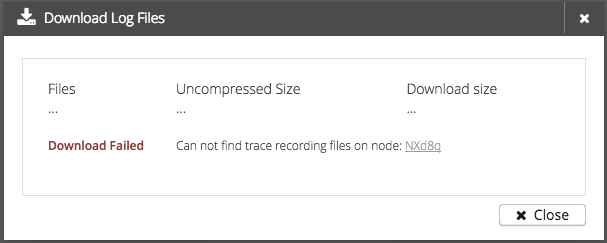
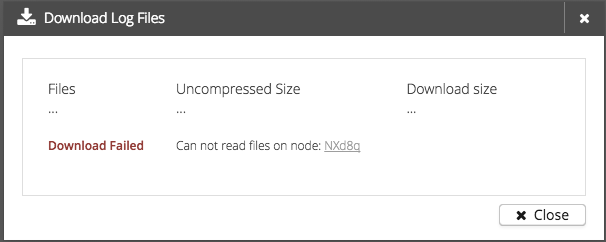
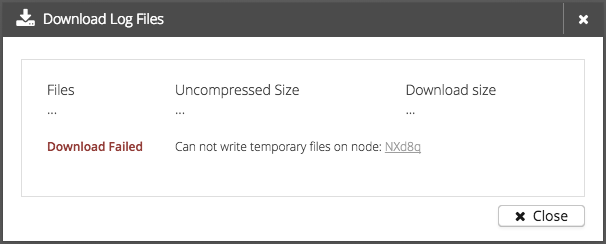
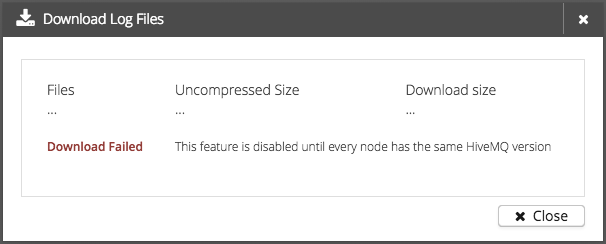
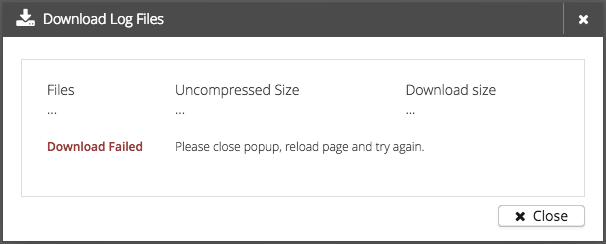
If something went wrong during the preparation, a warning message will be displayed.
Possible warnings are:
-
Not enough disk space (At least 100 MB must be free on every cluster node)
-
Files not found
-
Can’t read files
-
Can’t write files
-
Feature disabled during rolling upgrade
-
Any internal error
Some warnings may have a link to Dashboard with the cluster node as parameter to select the affecting nodes statistic tab.