Debugging Your HiveMQ Extensions
HiveMQ extension development typically involves a continuos cycle of testing, debugging, and deploying a custom extension to make sure that the final product functions as desired.
Debugging is key to the development of your custom HiveMQ extension because it shows you exactly how your extension behaves at runtime.
This in-depth view provides unique insights and makes it easier to quickly identify the cause of any unwanted behavior.
Debug Your HiveMQ Extensions with the Maven Plugin
The usual debugging procedure packs, unzips, and deploys extensions after every change.
This process is not suitable for quickly switching between development and testing.
Additionally, the extension can not be debugged without a running HiveMQ instance.
To facilitate extension development and provide a more convenient way to debug your extensions, HiveMQ created the HiveMQ Maven Plugin.
HiveMQ Maven Plugin Functionality
The HiveMQ Maven plugin automates the steps needed to run an extension on your HiveMQ instance.
To deploy a new extension, your development machine must have a HiveMQ instance that the Maven plugin can use. When the Maven plugin is invoked, the plugin creates an ad-hoc extension directory in the Maven build directory and moves the packaged extension files to that specially-created folder.
| The Maven plugin does not use the extensions folder of the HiveMQ instance. When you use the Maven plugin to start a HiveMQ instance, only the extensions folder in the Maven build directory is used. |
The following documentation gives you step-by-step information on how to use the HiveMQ Maven Plugin to debug a custom HiveMQ extension with
IntelliJ IDEA and Eclipse IDE for Java Developers.
The same basic procedure works with most Java IDE.
After the HiveMQ Maven Plugin prepares the extension, the local HiveMQ instance in the specified directory starts with the custom extensions folder.
HiveMQ console output becomes visible in your selected IDE. This functionality provides an easy and powerful way for extension developers to test a newly-created extension.
Additionally, you gain the ability to debug the extension during runtime with the Java remote-application debugging mechanism. Java remote debugging is a client/server concept in which the application (HiveMQ with extension) and IDE are able to be the server or the client. Each scenario has advantages and disadvantages:
-
HiveMQ with Extension as the Server and the IDE as Client
-
Advantage:
-
Easier handling, because you can start HiveMQ before you start the IDE debugger.
-
-
Disadvantage:
-
If the code you want to debug executes at startup, you must start the IDE client debugger very quickly to catch the code you want to debug before it passes through.
-
-
-
HiveMQ with Extension as the Client and the IDE as Server
-
Advantage:
-
You can debug code at startup.
-
-
Disadvantage:
-
Before you start HiveMQ, the debugging process of your IDE must be up and running.
-
-
Both of these options have appropriate uses. The configuration options of the HiveMQ Maven Plugin allow you to switch scenarios as needed. When you run HiveMQ in client mode, it is also possible to specify the connection port and the hostname of the server.
For more information on Java remote debugging in the context of HiveMQ extension development, see Debug Java applications remotely with Eclipse.
| If you want to run your extension without debugging, set the debugMode to NONE. For more configuration options, see HiveMQ Maven Plugin. |
HiveMQ Maven Plugin Workflow
The use of a Maven profile attached to a Maven package goal is an effective way to use the Maven plugin. This workflow triggers the extension that you want to run on HiveMQ every time the Maven package goal is executed and the profile RunWithHiveMQ is active.
To use the workflow as described, you need to make the following changes.
| If you created your project with the HiveMQ Extension Maven Archetype, this workflow is already part of your project. In this case, you simply need to provide the correct HiveMQ home folder in the configuration. |
-
Modify your pom.xml file as shown in the following example code:
pom.xml modification<?xml version="1.0" encoding="UTF-8"?>
<project ...>
...
<profiles>
<profile>
<id>RunWithHiveMQ</id>
<build>
<plugins>
<plugin>
<groupId>com.hivemq</groupId>
<artifactId>hivemq-maven-plugin</artifactId>
<version>4.0.2</version>
<executions>
<execution>
<id>hivemq</id>
<phase>package</phase>
<goals>
<goal>hivemq</goal>
</goals>
<configuration> (1)
<hiveMQDir>
/Applications/hivemq (2)
</hiveMQDir>
</configuration>
</execution>
</executions>
</plugin>
</plugins>
</build>
</profile>
</profiles>
...
</project>| 1 | Contains all configuration properties for the Maven plugin. |
| 2 | Specifies the HiveMQ home directory. If you have not yet downloaded HiveMQ, you can download the current version of HiveMQ from the HiveMQ website. |
Maven Plugin Configuration Options
The HiveMQ Maven plugin uses sensible default settings. However, you can adjust many of the settings to suit your individual use case.
The hivemqDir property identifies your local HiveMQ directory. This property is mandatory and does not have a default setting.
|
| Name | Default | Mandatory | Description |
|---|---|---|---|
|
The name of your local HiveMQ directory. If you have not yet downloaded HiveMQ, you can download the current version of HiveMQ from the HiveMQ website. |
||
|
hivemq.jar |
The name of the HiveMQ jar file in the bin directory. |
|
|
{artifactId}-{version}-distribution.zip |
The name of the extension zip file. |
|
|
target |
The directory in which your extension is located. |
|
|
true |
Defines whether the messages logged from HiveMQ are visible on the console. To view messages, set to true. |
|
|
false |
When this is set to true, HiveMQ starts without using the extension that is currently under development. You can use this setting to compare the behavior of HiveMQ with and without the extension. |
|
|
SERVER |
Specifies the debug mode of the Maven plugin. Possible values are NONE, SERVER, and CLIENT. NONE starts HiveMQ and the extension without debugging. To debug the bootstrapping part of your extension use CLIENT. For other purposes, use SERVER. To learn more about debug modes, see functionality section. Always make sure that the configuration of your IDE corresponds to your debug mode. |
|
|
5005 |
In SERVER mode, the debug port on which the debug server starts. In CLIENT mode, the debug port to which the client connects. |
|
|
localhost |
In CLIENT mode, this property can specify the host name of the debug server. For example, the machine on which your IDE runs. Use this property if you want to remotely debug your extension on another machine. For more information, see HiveMQ Maven Plugin Functionality. |
Debug Your HiveMQ Extension with IntelliJ IDEA
Server Mode
-
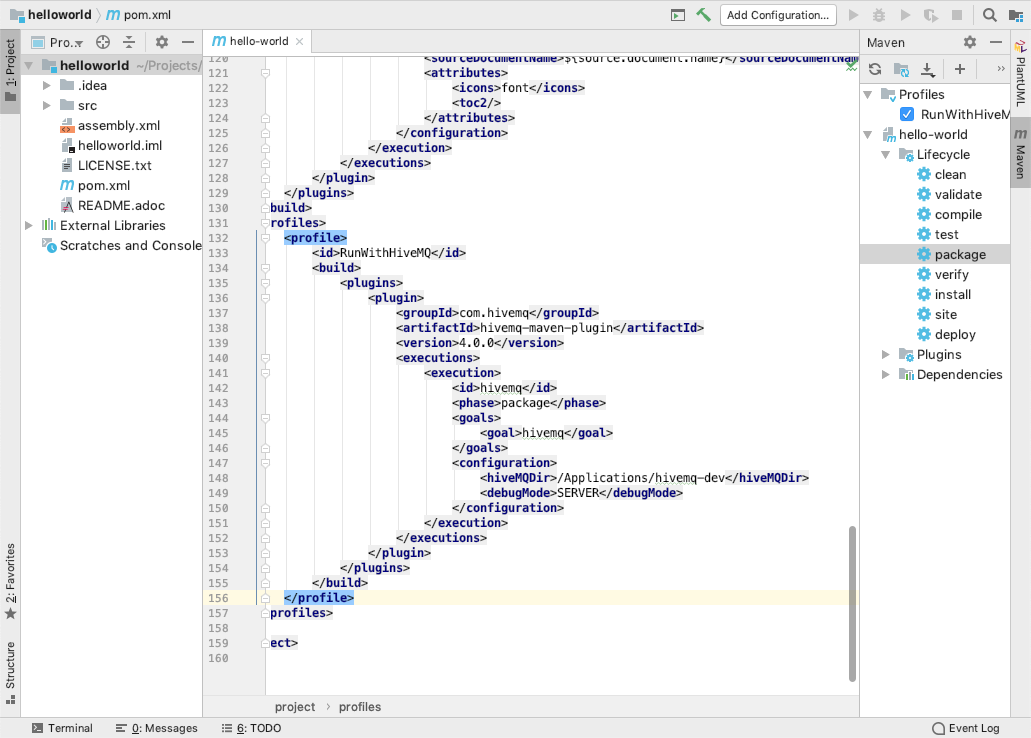
To debug your extension in server mode, set the debugMode to SERVER, select the RunWithHiveMQ profile, and run the Maven goal package:
-
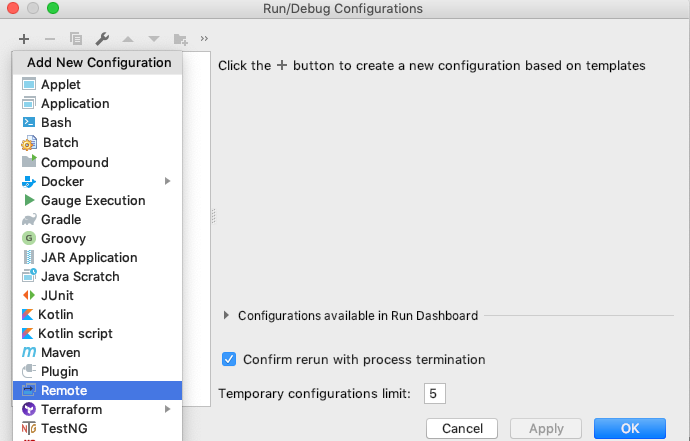
Create a new Remote Run configuration and select OK:
-
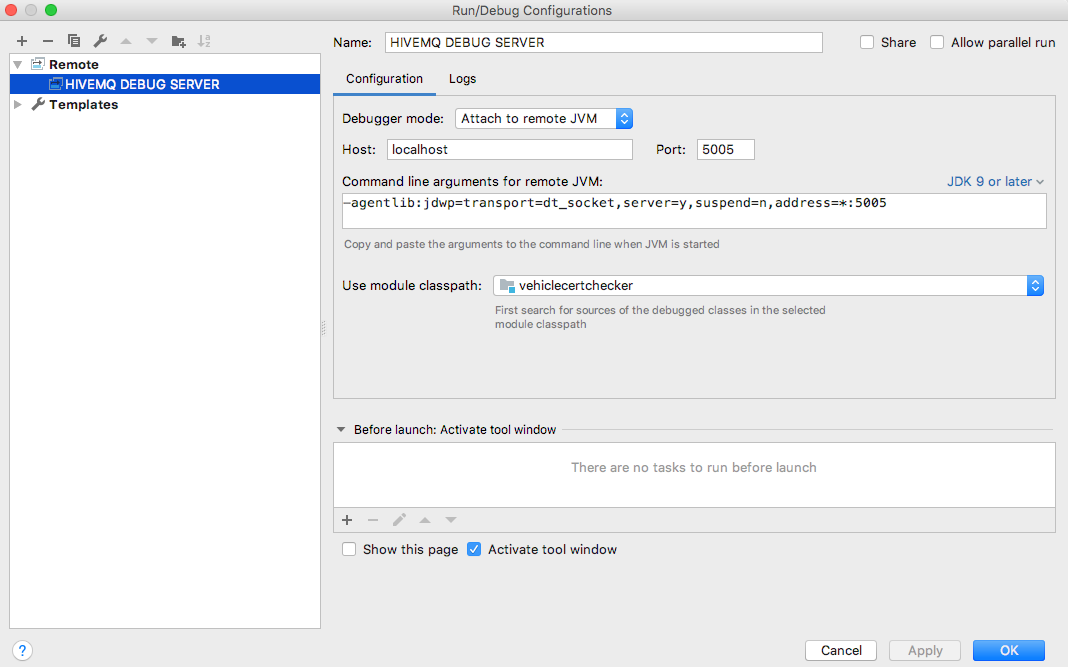
Make sure that your transport is set to socket, the Debugger mode is set to Attach to remote JVM, the port is 5005, and select OK:
-
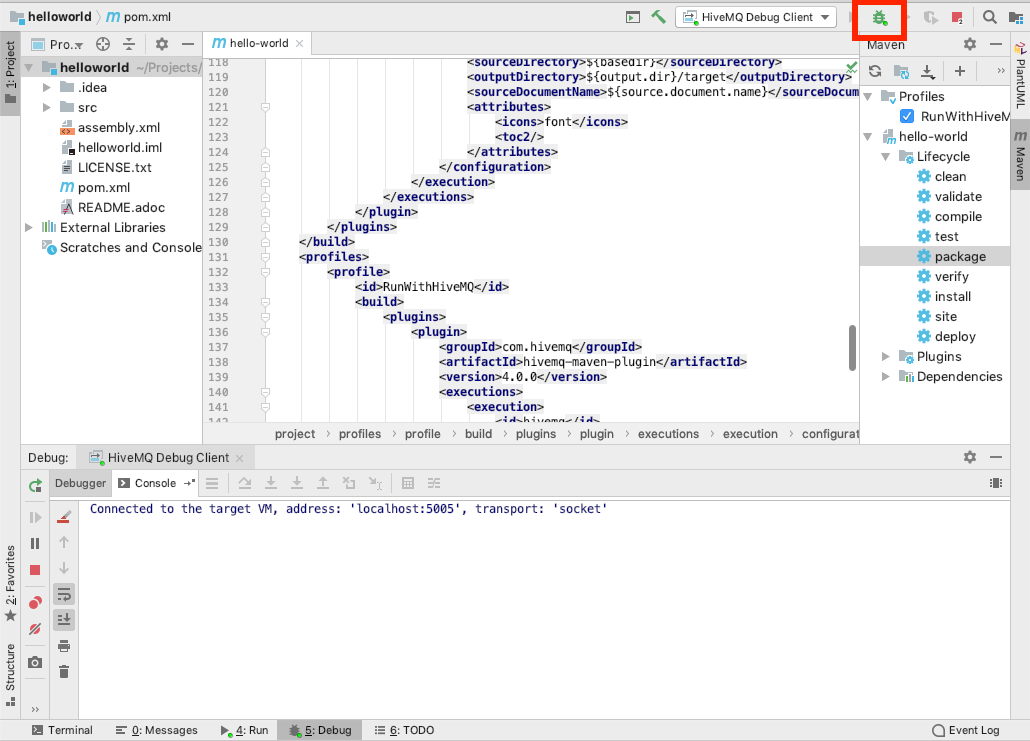
Run your newly-created configuration:
Client Mode
-
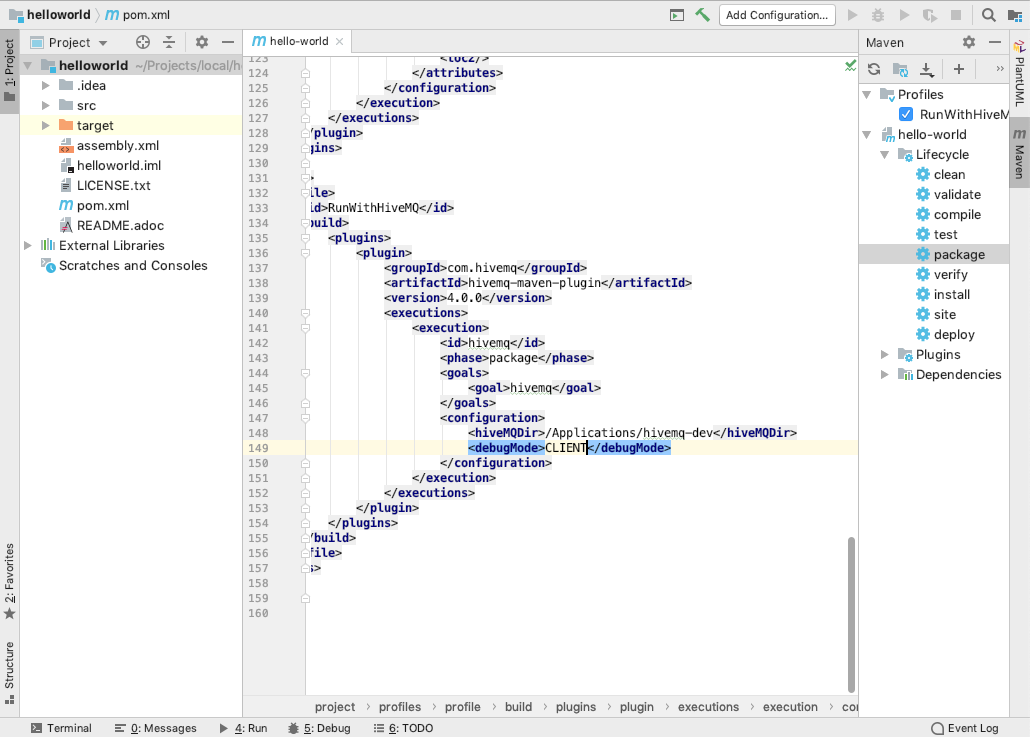
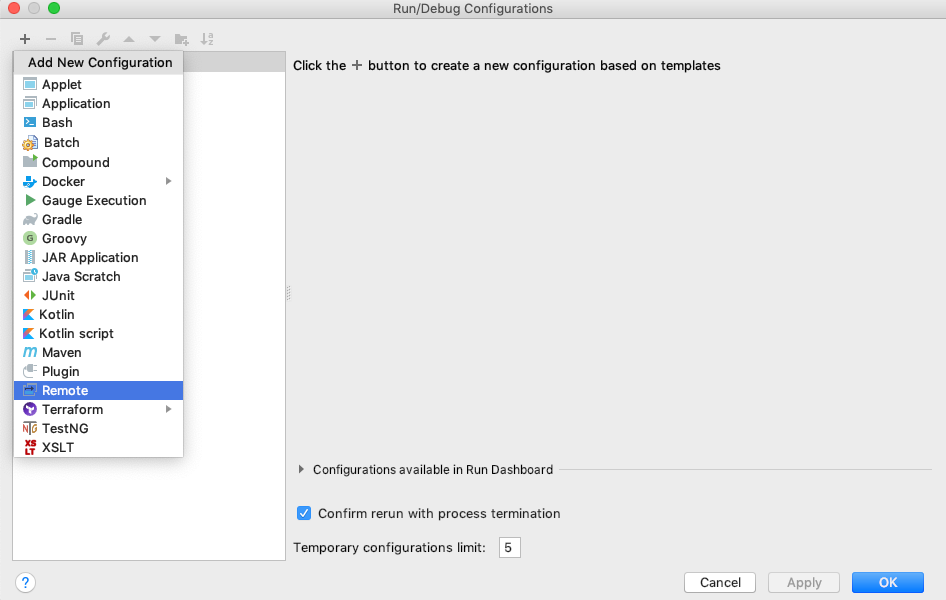
To debug your extension in client mode, set the debugMode to CLIENT and create a new Run Configuration:
-
Select Remote configuration and select OK:
-
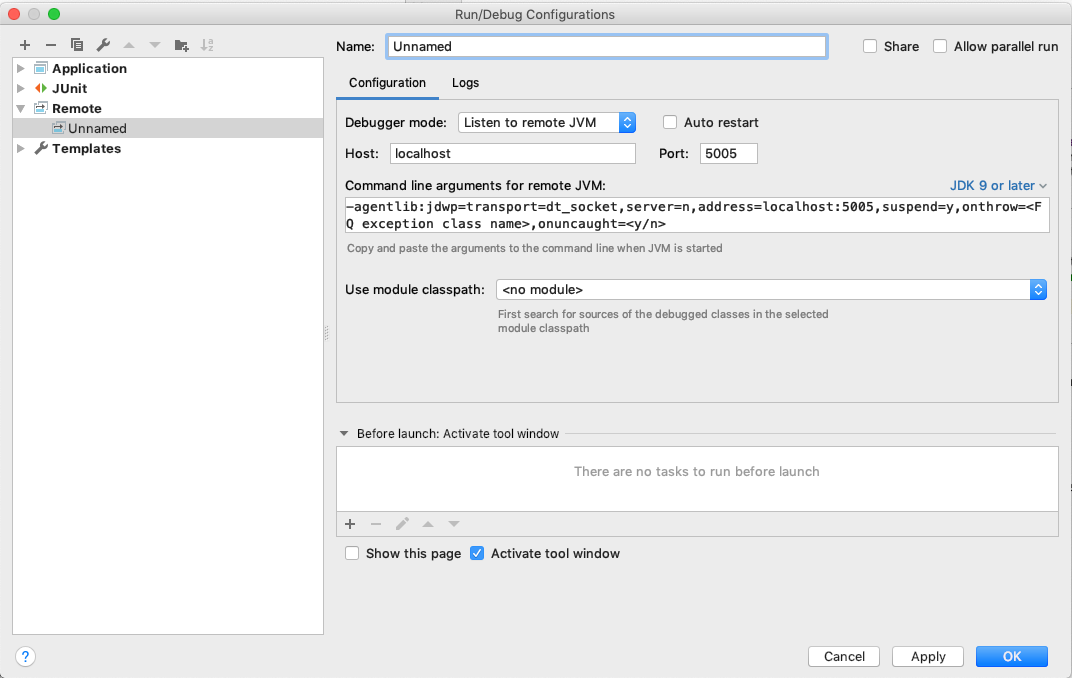
Make sure that your transport is set to socket, the Debugger mode is set to Listen to remote JVM, the port is 5005, and select OK:
-
Run your newly-created configuration:
-
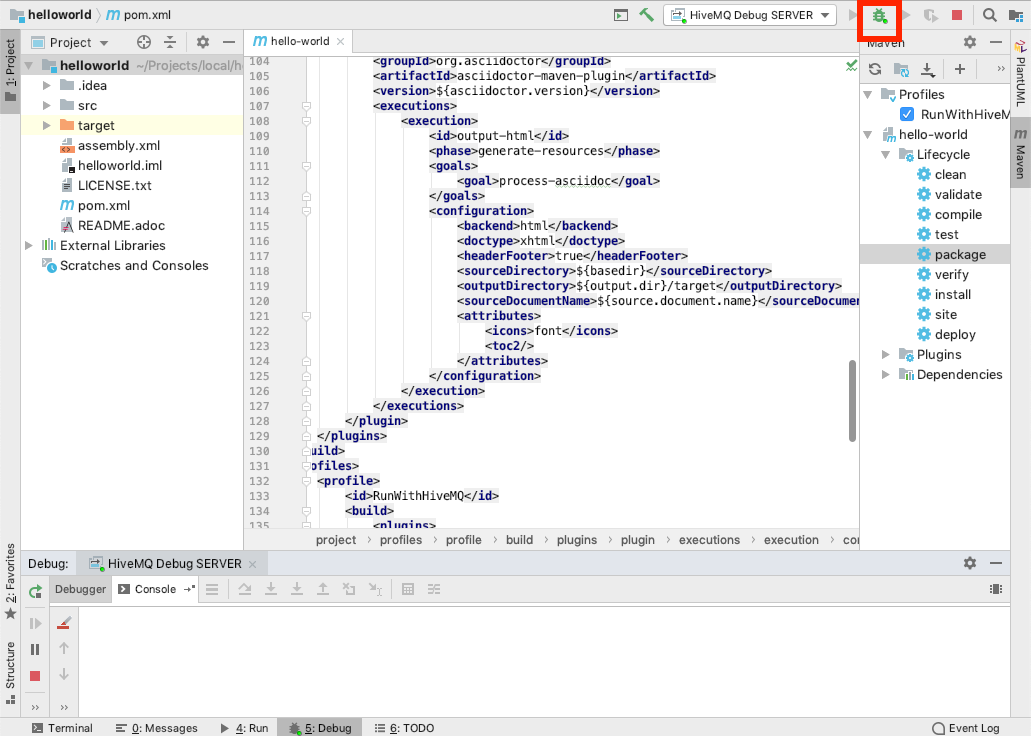
Run the Maven package and wait until HiveMQ starts:
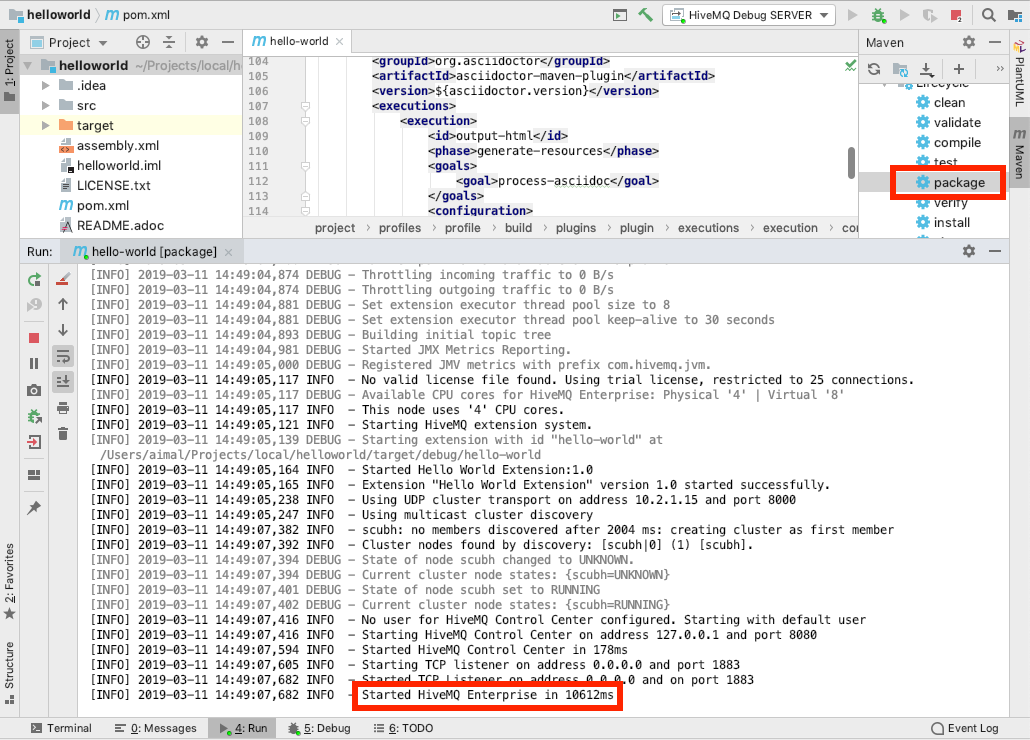
-
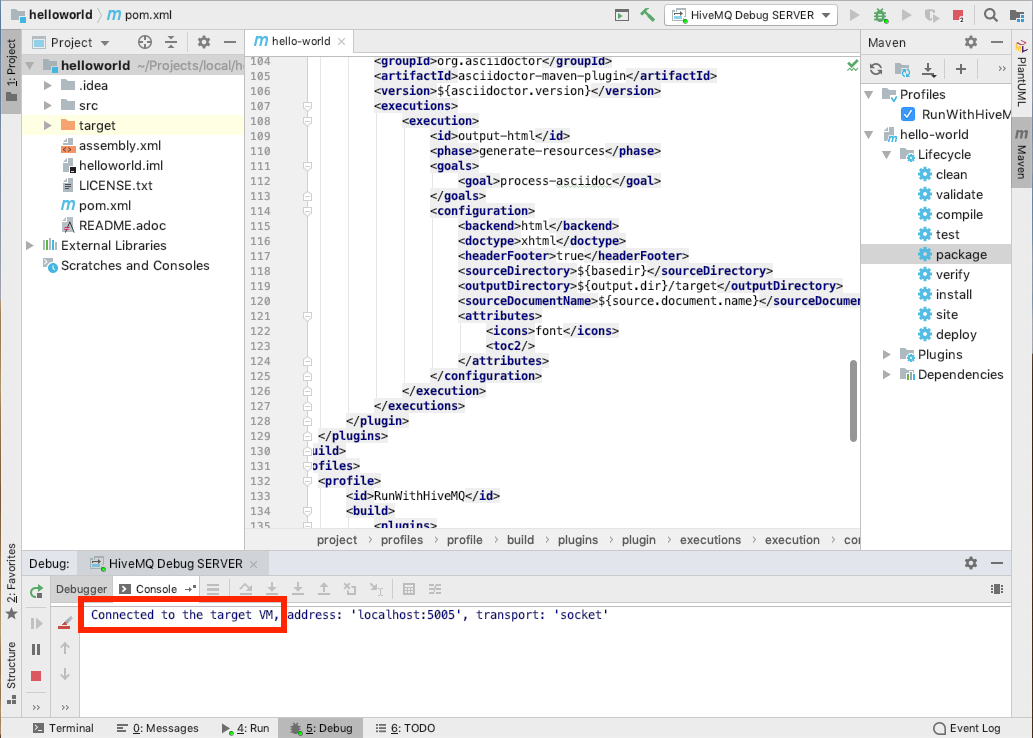
Switch to the Debug window and verify that the status is Connected:
Debug Your HiveMQ Extension with Eclipse IDE for Java Developers
Maven Goal Package
-
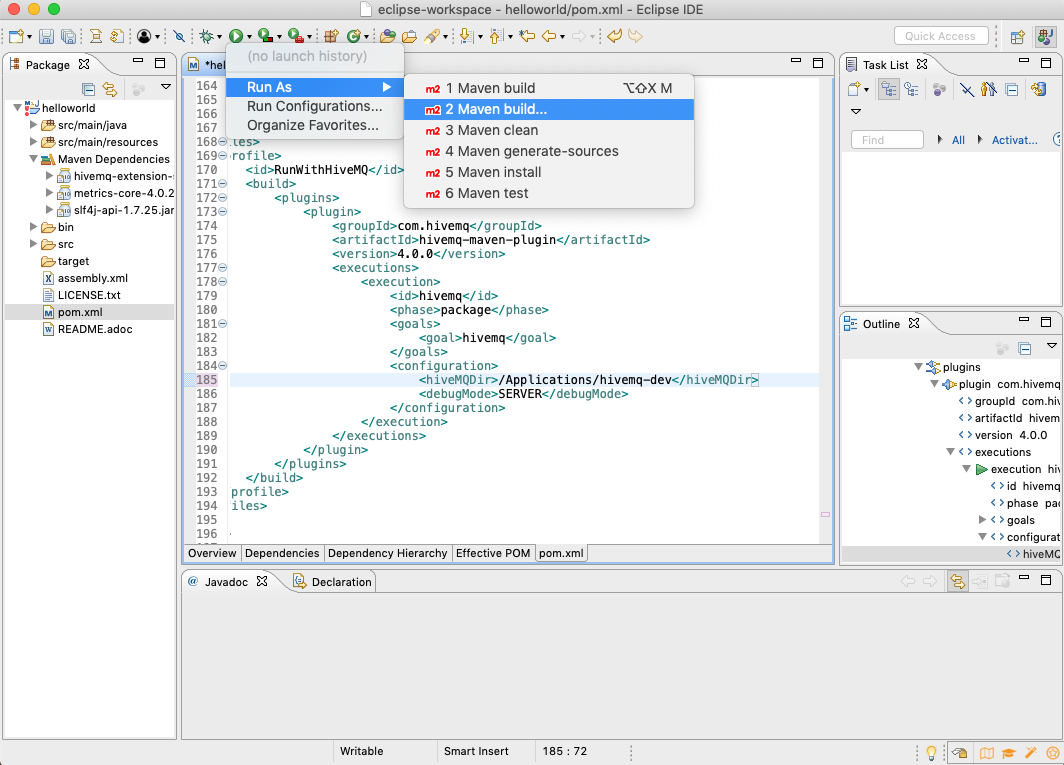
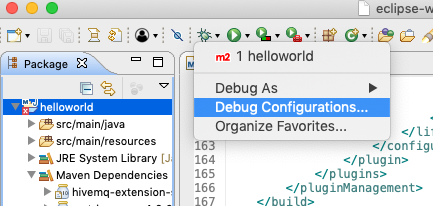
Create a new Run Configuration for the Maven goal:
-
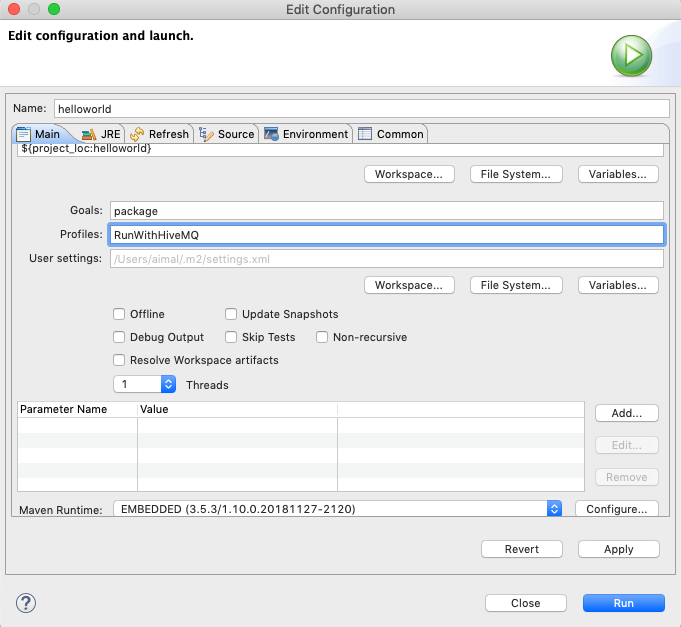
Enter package as the Maven goal and RunWithHiveMQ as the profile:
-
To complete the setup, select Apply.
Server Mode
-
To debug your extension in server mode, create a new debugMode configuration element, set the value to SERVER, and run the package Maven goal :
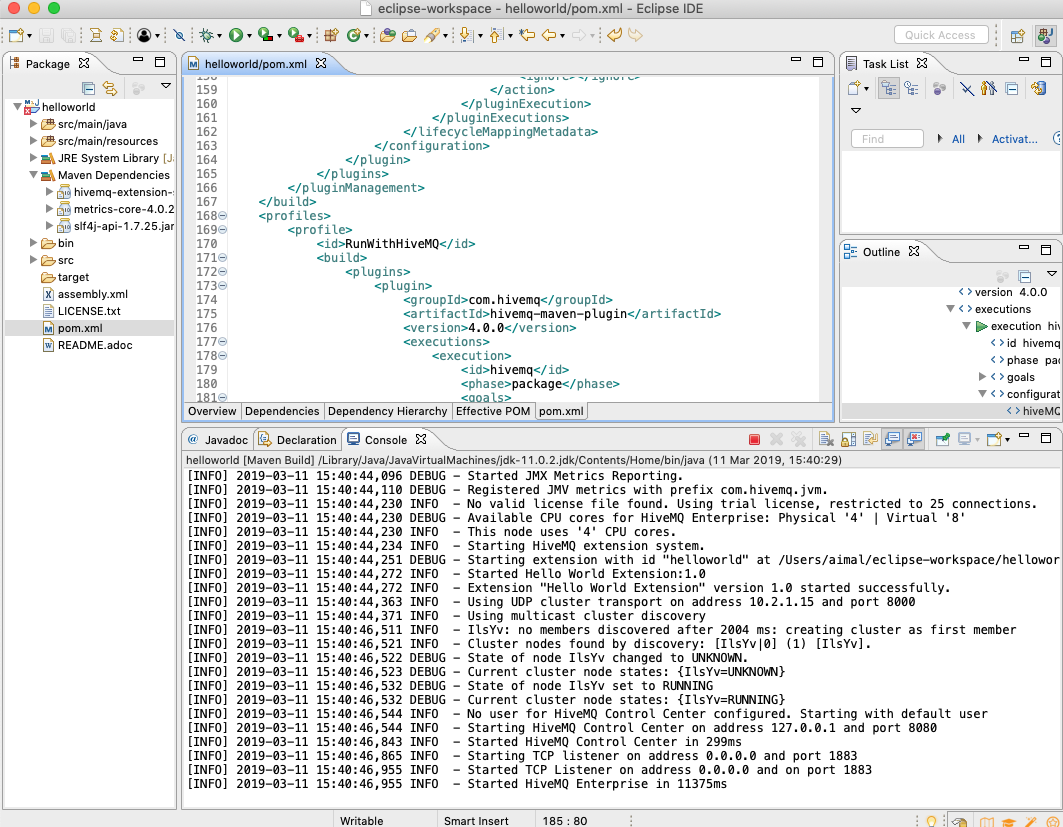
-
Create a new Remote Java Application configuration:
-
Make sure the connection type is Standard (Socket Attach), the host is localhost, the port is 5005, and select Debug:
-
The debugger starts.
Client Mode
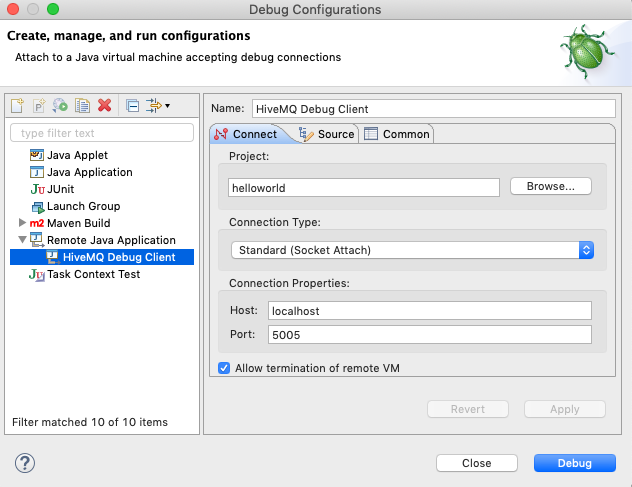
-
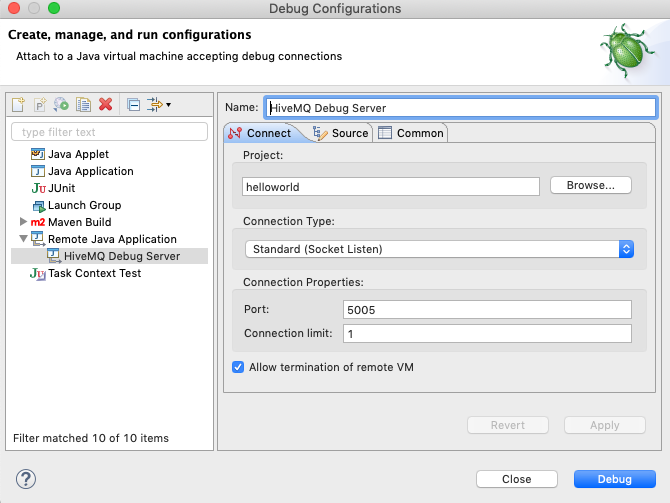
To debug your extension in client mode, create a new remote Java application Debug Configuration:
-
Make sure that the connection type is Standard (Socket Listen), the port is 5005 and select Debug.
-
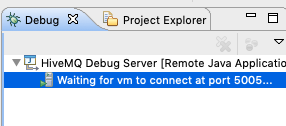
Switch to the Debug tab and verify that the debugger is listening:
-
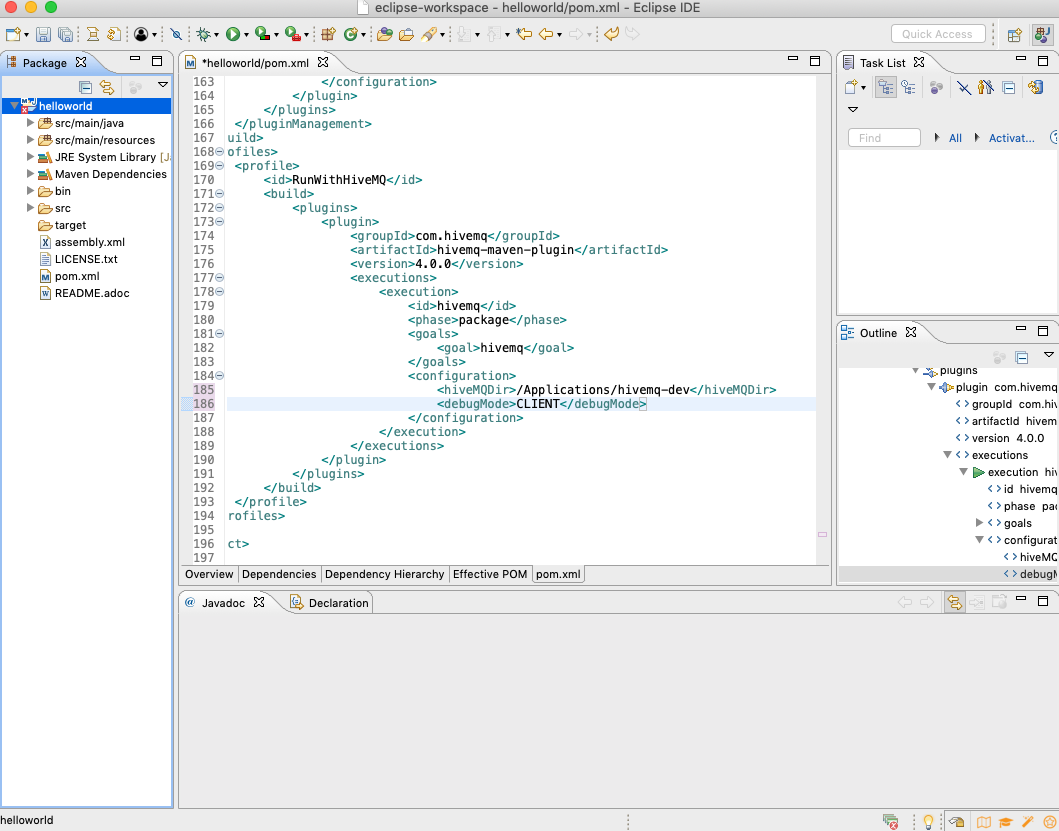
Create a new debugMode configuration element, set the value to CLIENT, and run the package Maven goal:
-
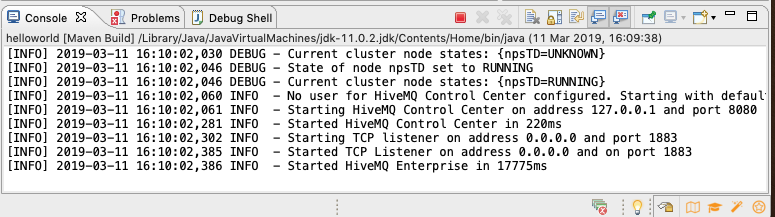
Start HiveMQ and wait until your HiveMQ instance starts:
-
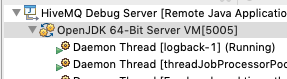
Verify that the debugger is connected:
Debug with HiveMQ Testcontainer
You can debug the extension in the same way as described in Debug IntelliJ and Debug Eclipse. Simply set the port binding for the debug port:
@Rule
public final @NotNull HiveMQTestContainerRule rule = new HiveMQTestContainerRule()
.withDebugging(5005);| Select a port that is not used by another application. |
Debug with the HiveMQ Gradle Plugin
HiveMQ also offers an Gradle plugin to simplify the deployment and debugging of your HiveMQ extensions.
For more information, see HiveMQ Extension Gradle Plugin.