A quality trend starts to drift on a stamping line. The data that should explain it exists but, at one site it sits in a historian, at another it has a different name and somewhere else it reaches the lakehouse hours later. By the time the team has a number everyone trusts, the shift is over and the scrap is already on a pallet.
In the more than 12 years that HiveMQ has helped industrial teams move data reliably, this is a pattern we've seen again and again. Getting data off the machine is only part of the job. That data also has to arrive in time, mean the same thing across sites, and stay aligned with the operation as equipment and processes change. Connected is not the same as usable.
The new HiveMQ Platform builds on the MQTT streaming foundation customers already run, and adds the next steps between the machine and the decision: Connect, Contextualize, Analyze and Act.
- Connect gets the data flowing.
- Contextualize gives it shared structure and meaning, and checks that live data still matches that definition.
- With Analyze, those trusted inputs become the values your operation actually manages by.
- Act puts that intelligence back into the workflow, with the level of human oversight your team chooses.
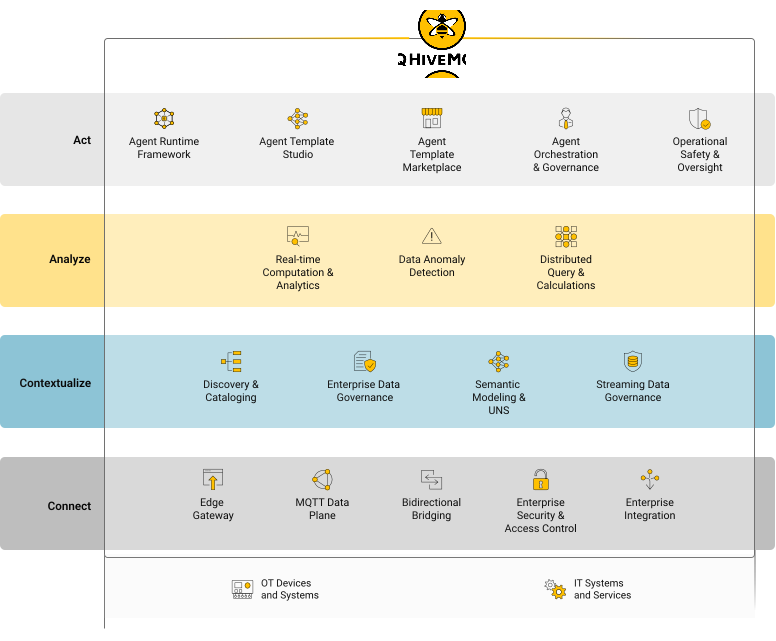
One place to move operational data, give it meaning, verify it and act on it, distributed across edge, site and cloud.
Connect: Stop rebuilding integrations for every new use case
A new use case should not need a new integration project. However, in many industrial environments, every new data consumer still comes with its own connection to the source, its own transformation logic and its own security setup. When you continue to add more enough consumers, the integration backlog grows with them.
That is the role of the Connect layer: connect operational systems once and make their data continuously available to multiple applications, services and downstream consumers. Where equipment does not speak MQTT, HiveMQ Edge translates protocols such as OPC UA and Modbus into MQTT. MQTT-native devices can publish directly to HiveMQ Broker. If a connection drops, Edge can buffer data locally and forward it when the link returns rather than leaving a gap to reconcile later.
Once the data is on the MQTT backbone, the next consumer does not need another point-to-point integration. A dashboard, historian, application or analytics system can subscribe to the streams it needs. Delivery guarantees are set per client, while TLS and topic-level permissions are enforced at the broker, so those controls do not have to be rebuilt for every new use case.
:format(webp))
Publish once. Multiple consumers use the same real-time flow.
The Connect layer also works with the HiveMQ infrastructure you already run. Existing Broker and Edge deployments can be connected to HiveMQ Platform and appear in the Network view, giving teams visibility into which instances are connected and reporting.
The useful test is what happens when the next use case arrives. It should take less engineering effort to connect another consumer, create fewer one-off integrations to maintain and add less to the integration backlog.
Contextualize: Make site two easier than site one
Plenty of industrial pilots work at the first site because the people who built them know the tag names, the calculations, the asset structure and all the local exceptions. The difficulty comes when the same use case has to move to site two, where the equipment, naming conventions and process details are different. The Contextualize layer turns that local knowledge into something teams can find, understand and reuse.
Discovery shows the MQTT traffic already flowing through a connected broker but not yet represented in the namespace. It infers useful information such as the data type and a sample payload, so teams can review what they have and bring the relevant topics under governance.
Namespace then gives that data a structure that reflects the operation. It can follow common industrial hierarchies such as ISA-95, while still giving teams the flexibility to organize sites, areas, lines, assets and other nodes around the way they actually work. That structure stays aligned with the underlying MQTT data and is synchronized across connected brokers, giving teams a searchable view of what data exists across the estate.
Data models make that structure reusable. Once a team has modeled an asset or part of a line, it can turn that structure into a versioned model and create an instance elsewhere in the namespace. Each instance stays on the version it was created from, so teams can evolve a model without unexpectedly changing sites that are already using it.
:format(webp))
Build a governed namespace around the structure of your operation, then reuse data models across sites, lines and assets.
Computations extend the same idea to derived values. A tag can calculate its value from other tags using a predefined calculation or an expression, with the computation running on the broker carrying that site's traffic. That can be a simple derived value or something state-based, such as time spent in a condition. The result is a value defined once from known inputs, rather than recalculated differently by every downstream consumer.
The practical test is whether site two gets easier than site one: less time preparing and interpreting data, less work to reproduce the same use case, and more of the structure and definitions carried forward instead of rebuilt.
Analyze: See the deviation while you can still do something about it
Even governed data can drift. A device gets replaced, firmware changes, someone adds a field to a payload, and the data arriving no longer matches the definition everyone downstream is relying on. The Analyze layer shows whether live operational data still conforms to what you defined in the Contextualize layer.
Data Health separates total traffic into governed and ungoverned traffic, then shows whether governed traffic is healthy, deviating or ignored. Teams see the same breakdown by broker and follow how it changes over time.
When something deviates, the broker compares incoming messages against the namespace definition close to where the data is produced. A deviation can mean a required field is missing, the payload contains a field that was never defined or a value no longer matches the expected type or format.
For example, say a temperature tag is defined as a decimal and a replacement sensor starts publishing 23.6C. The deviation record shows the namespace path and topic, the expected data type, the last valid payload and the payload that failed. Seeing the expected and actual values together makes it much easier to understand what changed.
:format(webp))
Data Health shows how much operational traffic is governed and where governed data is healthy, deviating or ignored.
Analyze is deliberately focused. It tells you whether live data still matches the definition you have agreed on. It does not replace a historian, BI stack or machine anomaly-detection system. The fix may be at the source or in the definition, and only connected brokers can report their current health.
The practical test is whether teams find data problems earlier and resolve them faster: more operational traffic under governance, less time spent figuring out why a value changed, and fewer bad definitions making their way into downstream use cases.
Act: Close the loop without giving up control
IN PUBLIC PREVIEW
Most industrial data architectures stop at the point where someone sees a problem. A number turns red on a dashboard, and what happens next depends on who is on shift, what they know and which system they open first. The Act layer adds a governed path back into the workflow. An agent defines what it needs to sense, how it should reason about what it sees and what actions it is allowed to take.
Creating an agent starts directly in Act. Teams can start from a ready-made agent template in the Marketplace or describe the job to Bea, the platform assistant. Either way, the starting configuration opens in the Agent Builder, where teams can refine the agent's connections, reasoning, actions and human oversight before deployment.
Each agent follows the same basic cycle:
- Sense collects the information it needs from MQTT topics, APIs, or databases.
- Reason evaluates that information using deterministic rules where the logic is fixed or a model where interpretation is needed.
- Actuate carries out a permitted action, such as publishing to MQTT, calling an API, or opening a ticket.
- Reflect keeps useful context for the next cycle.
:format(webp))
Act agents sense, reason, actuate and reflect, with human oversight configured to match the action and its risk.
The level of oversight can be set per action. Autonomous actions run without human review. Supervised actions go to a person for review, with a defined fallback if nobody responds. Controlled actions wait for explicit approval. The lane can differ by action, so the level of human involvement follows the risk.
Once the agent is ready, teams deploy it from Act. They select a Network and Orchestrator for the deployment. The Network groups agents, orchestrators, and shared resources for a site or environment, so teams can configure resources such as databases and APIs once and reuse them across agents. After deployment, the agent appears in Deployed Agents, where teams can monitor its status, health, metrics, and logs.
Agents run as containers under an orchestrator on your own infrastructure, next to the brokers. The orchestrator starts the connection to HiveMQ Platform to receive its agents and report health. HiveMQ Platform does not connect into your environment, so you keep control over what crosses your Network boundary.
The value is not only faster response. It is also about making response patterns explicit instead of leaving them in the head of one experienced operator, so the same process can be applied consistently across shifts and sites.
The practical test is whether the response itself becomes more repeatable: less time between detecting an issue and starting the right action, more operational response patterns captured in a reusable form, and less dependence on who happens to be on shift.
One signal, from the machine to the decision
The value becomes clearer when you follow one piece of operational data all the way through.
Take a vibration reading from a stamping press:
- Connect gets that signal onto HiveMQ Broker's shared MQTT data plane, directly from an MQTT source or through HiveMQ Edge when protocol translation is needed.
- Contextualize places it on the press asset in a governed namespace, using a structure that can be reused at other sites.
- Analyze checks that the live payload continues to match the definition teams are relying on and surfaces a deviation when it does not.
- Act can then use that governed data as part of a response, within the level of human oversight configured for the action.
The value is not just in any one of those steps on its own. It is that the same operational data can move from the machine into new applications, sites and workflows without being re-integrated, reinterpreted and rebuilt at every step. The work you do to make the data usable for one use case becomes part of the foundation for the next one.
HiveMQ Platform builds that broader workflow on the MQTT foundation HiveMQ customers already use for demanding industrial workloads. Mercedes-Benz, for example, uses HiveMQ for vehicle diagnostics across 24 plants and more than 10,000 testing devices, moving 470 million messages a month. HiveMQ supports MQTT 3.1, 3.1.1 and 5 and is backed by ISO 27001 and SOC 2 certification.
Start with one operational improvement. Scale the results.
You probably already know where the friction is. Maybe every new consumer creates another integration project, or a successful pilot has to be rebuilt at the next site. Maybe teams spend too much time figuring out whether the data itself has changed, or maybe the response to an operational issue still depends on who happens to be on shift.
Start there.
HiveMQ Platform gives you a way to address the data problem underneath that use case, while building a foundation that the next use case can reuse.
Get started with HiveMQ Platform
