Monitoring
System monitoring is an essential part of every production-software deployment. Monitoring your MQTT brokers is vital, especially in clustered environments. HiveMQ is designed to accommodate different kinds of monitoring easily. When you run HiveMQ in critical infrastructure, we strongly recommend use of an appropriate monitoring application.
The highly-performant metrics subsystem of HiveMQ lets you monitor relevant metrics with no reduction in system performance (even in low-latency high-throughput environments).
| Some metrics are not available in the HiveMQ Community Edition. |
Monitoring HiveMQ MQTT Broker Using JMX
HiveMQ exposes a large number of metrics with Java Management Extensions (JMX) and enables monitoring with JMX monitoring tools such as JConsole.
Configuration
If you run HiveMQ behind NAT (Network Address Translation), you need to set some additional options:
JAVA_OPTS="$JAVA_OPTS -Djava.rmi.server.hostname=<PUBLIC_IP>"
JAVA_OPTS="$JAVA_OPTS -Dcom.sun.management.jmxremote.rmi.port=9010"
This configuration allows you to connect with JConsole using PUBLIC_IP:9010.
MBeans
By default, the following MBeans (managed Java objects) are available for monitoring:
| MBean Name | Description |
|---|---|
|
The HiveMQ metrics and statistics. A list of all available metrics is available here. |
|
Statistics and metrics about used native memory. |
|
All information about the Java Virtual Machine. |
|
Actions that can be started via JMX. |
Maintenance
Some maintenance actions are resource intensive. In general, we recommend that you do not combine system maintenance tasks with cluster topology changes. If you have recently added or removed HiveMQ instances, verify that the topology change is complete and that the cluster size is as expected before you start maintenance.
| Maintenance action | Description |
|---|---|
|
Removes outdated subscriptions that were added during network splits. |
Monitoring HiveMQ MQTT Broker Using Prometheus
Prometheus is a popular open-source solution for event monitoring and alerting. Prometheus provides a simple and powerful dimensional data model, flexible query language, efficient time-series database, and real-time metrics.
The HiveMQ Prometheus Monitoring Extension allows HiveMQ to expose metrics to a Prometheus application.
Install the HiveMQ Prometheus Monitoring Extension
-
Download the HiveMQ Prometheus Monitoring Extension from the HiveMQ Marketplace (free of charge).
-
Unpack the
hivemq-prometheus-extension-<version>.zipfile. -
Move the entire
hivemq-prometheus-extensionfolder to theextensionsfolder of your HiveMQ installation. -
Adjust the
prometheusConfiguration.propertiesfile that is located in thehivemq-prometheus-extensionfolder to meet your individual needs. For more information, see Configuration Options. -
Start HiveMQ.
Configuration Options
The HiveMQ Prometheus Monitoring Extension is preconfigured with standard property settings.
You can adapt properties of the prometheusConfiguration.properties file in the hivemq-prometheus-extension folder to fulfill for your specific use case.
| Configuration | Default | Description |
|---|---|---|
|
|
The port on which the servlet listens. |
|
|
The bind-address which the servlet will listen to. |
|
|
The path that Prometheus calls for the service. The path must start with a slash. For example, |
# Prometheus Monitoring Extension Configuration
# -------------------------------------------------------------------------

# The ip where the servlet will be hosted
ip=0.0.0.0

# The port where the servlet will work on
port=9399

# The path for the servlet which gets called by prometheus
# <ip>:<port> and <metric_path>
# For example 127.0.0.1:9399/metrics
metric_path=/metrics| Be sure to verify that your Prometheus server can reach the IP address of the network interface. |
Test Extension Configuration
To test the configuration of your HiveMQ Prometheus Monitoring Extension, use your browser to navigate to the <ip>:<port><metric_path> that is configured in your prometheusConfiguration.properties file.
For example, if you use the default configuration values, navigate to http://localhost:9399/metrics.
Information similar to the following verifies that the extension is available:
# HELP com_hivemq_messages_incoming_publish_rate_total Generated from Dropwizard metric import
(metric=com.hivemq.messages.incoming.publish.rate, type=com.codahale.metrics.Meter)
# TYPE com_hivemq_messages_incoming_publish_rate_total counter
com_hivemq_messages_incoming_publish_rate_total 0.0
# HELP com_hivemq_messages_incoming_pubrec_rate_total Generated from Dropwizard metric import (metric=com.hivemq.messages.incoming.pubrec.rate, type=com.codahale.metrics.Meter)
# TYPE com_hivemq_messages_incoming_pubrec_rate_total counter
com_hivemq_messages_incoming_pubrec_rate_total 0.0
...
Install Prometheus
-
Download Prometheus and install the Prometheus application on a machine of your choice.
For best results, we recommend that you do not run Prometheus on the same machine as HiveMQ.
A step by step Prometheus getting started guide and detailed configuration information are available in the Prometheus documentation. -
To enable Prometheus to gather metrics from HiveMQ, add a scrape configuration to your Prometheus configuration. Scrape from the
<ip>:<port><metricPath>address that you entered in theprometheusConfiguration.propertiesfile of your HiveMQ Prometheus Monitoring Extension. -
Open the web address of your Prometheus application and verify that HiveMQ metrics are visible.
global:
scrape_interval: 15s
scrape_configs:
- job_name: 'hivemq'
scrape_interval: 5s
metrics_path: '/metrics'
static_configs:
#using port 9399 as configured in the HiveMQ Prometheus Extension
- targets: ['<node1-ip>:9399', '<node2-ip>:9399']| This example is for a 2 node cluster. If you want more nodes, add the additional nodes to the targets. |
Display HiveMQ Metrics in Prometheus
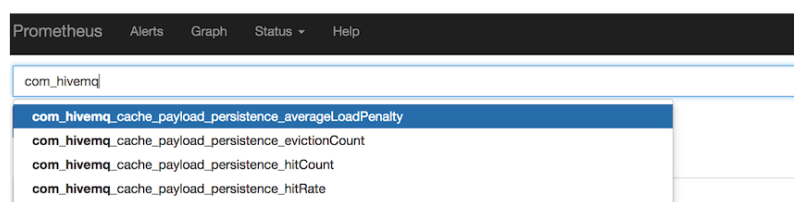
Prometheus provides built-in functionality to display metrics on-the-fly that can be helpful when you want an in-depth look into specific metrics that you do not monitor constantly. Navigate to http://:9090/. When Prometheus and the HiveMQ Prometheus Monitoring Extension are configured correctly, you can access your HiveMQ metrics in the Expression field.
Frequently, Prometheus is used as a data source for monitoring dashboards such as Grafana. For a complete tutorial on how to set up a Grafana dashboard and use Prometheus as a data source to monitor HiveMQ, see HiveMQ - Monitoring with Prometheus and Grafana.
Monitoring HiveMQ MQTT Broker Using InfluxDB
InfluxDB is a widely-used open-source time-series database that is written in Go and optimized for fast, high-availability storage and retrieval of time-series data. InfluxDB is a popular choice for gathering and visualizing application metrics, Internet of Things sensor data, and real-time analytics to gain deeper insights.
The HiveMQ InfluxDB Monitoring Extension allows HiveMQ to connect to an instance of InfluxDB for time-series monitoring.
Install the HiveMQ InfluxDB Monitoring Extension
-
Download the HiveMQ InfluxDB Monitoring Extension from the HiveMQ Marketplace (free of charge).
-
Unpack the
hivemq-influxdb-extension-<version>.zipfile. -
Move the entire
hivemq-influxdb-extensionfolder to theextensionsfolder of your HiveMQ installation. -
Modify the
influxdb.propertiesfile that is located in thehivemq-influxdb-extensionfolder to meet your individual needs. Thehostandportproperties are mandatory. For more information, see Configuration Options.
Configuration Options
The HiveMQ InfluxDB Monitoring Extension is preconfigured with standard property settings.
You can adapt properties of the influxdb.properties file that is located in the hivemq-influxdb-extension folder to match your specific use case.
The host and port properties are mandatory.
The InfluxDB extension cannot start if the influxdb.properties file is missing or if the required host and port properties are not set.
|
| Configuration | Default | Environment Variable | Description |
|---|---|---|---|
|
|
HIVEMQ_INFLUX_DB_PLUGIN_MODE |
The mode that is configured for the InfluxDB sender. The following modes are possible: : |
|
|
HIVEMQ_INFLUX_DB_PLUGIN_HOST |
The host name of the InfluxDB instance. The |
|
|
HIVEMQ_INFLUX_DB_PLUGIN_PORT |
The port number on which the InfluxDB instance listens. The |
|
|
HIVEMQ_INFLUX_DB_PLUGIN_PROTOCOL |
The protocol the InfluxDB sender uses in HTTP mode. |
|
HIVEMQ_INFLUX_DB_PLUGIN_AUTH |
The authorization string that is used to connect to InfluxDB. The format of the string is username:password. |
|
|
HIVEMQ_INFLUX_DB_PLUGIN_PREFIX |
The measurement prefix. |
|
|
|
HIVEMQ_INFLUX_DB_PLUGIN_DATABASE |
The database name. |
|
|
HIVEMQ_INFLUX_DB_PLUGIN_REPORTING_INTERVAL |
The reporting interval in seconds. |
|
|
HIVEMQ_INFLUX_DB_PLUGIN_CONNECTION_TIMEOUT |
The connect and read timeout in seconds. |
|
HIVEMQ_INFLUX_DB_PLUGIN_TAGS |
The tags for each metric. Listed as a semicolon ( ; ) separated list. |
mode:http
host:localhost
port:8086
protocol:http
auth:

prefix:
database:hivemq

reportingInterval:1
connectTimeout:5000

tags:host=hivemq1
To ensure that you can easily match metrics to the right node in your HiveMQ cluster, define a unique host tag for each HiveMQ node.
For example, in a two-node cluster, assign one node tag:host=hivemq1 and the other node tag:host=hivemq2.
|
Quick Start for InfluxDB on Docker
If you do not have an InfluxDB instance set up, use the following procedure to start a not configured InfluxDB instance with Docker.
-
Download and install Docker for your platform.
-
Start an InfluxDB docker container with the command: docker run -p 8086:8086 -v $PWD:/var/lib/influxdb influxdb.
A local instance of InfluxDB starts with the port for the database set to 8086.
For more information about using InfluxDB with Docker, see the official Docker repository for InfluxDB. -
Create a database that matches the name that is set in the
databaseproperty ininfluxdb.propertiesfile.
To use the defaultdatabasevalue enter the command: curl -G http://localhost:8086/query –data-urlencode “q=CREATE DATABASE hivemq”.
Usage
After you install the HiveMQ InfluxDB Monitoring Extension and set up an InfluxDB instance, start HiveMQ. If a configuration file exists and contains the required properties, the extension has successfully started.
For a complete tutorial on how to set up a Grafana dashboard and use InfluxDB as a data source to monitor HiveMQ, see HiveMQ - Monitoring with InfluxDB and Grafana.
Available Metrics
HiveMQ exposes five different types of metrics:
| Metric Type | Description |
|---|---|
|
A gauge returns a simple value at the point of time the metric was requested. |
|
A counter is a simple incrementing and decrementing number. |
|
A histogram measures the distribution of values in a stream of data. They allow to measure min, mean, max, standard deviation of values and quantiles. |
|
A meter measures the rate at which a set of events occur. Meters measure mean, 1-, 5-, and 15-minute moving averages of events. |
|
A timer is basically a histogram of the duration of a type of event and a meter of the rate of its occurrence. It captures rate and duration information. |
Standard HiveMQ Metrics
The following HiveMQ metrics are available for all single node and clustered HiveMQ server instances:
| Metric | Type | Description |
|---|---|---|
|
|
Cache statistic capturing the average load penalty of the shared subscription cache |
|
|
Cache statistic capturing the eviction count of the shared subscription cache |
|
|
Cache statistic capturing the hit count of the shared subscription cache |
|
|
Cache statistic capturing the hit rate of the shared subscription cache |
|
|
Cache statistic capturing the load count of the shared subscription cache |
|
|
Cache statistic capturing the load exception count of the shared subscription cache |
|
|
Cache statistic capturing the load exception rate of the shared subscription cache |
|
|
Cache statistic capturing the load success count of the shared subscription cache |
|
|
Cache statistic capturing the miss count of the shared subscription cache |
|
|
Cache statistic capturing the miss rate of the shared subscription cache |
|
|
Cache statistic capturing the request count of the shared subscription cache |
|
|
Cache statistic capturing the total load time of the shared subscription cache |
|
|
The total number of client events stored including all replicas |
|
|
The number of retry attempts that are processed to resolve the name of a node |
|
|
The current number of nodes in the cluster |
|
|
Measures the time spent waiting for cluster topology changes |
|
|
The current number of tasks queued in the cluster message executor |
|
|
The current number of queues in the cluster message executor |
|
|
The number of failed TLS handshakes on the HiveMQ Control Center |
|
|
The number of successful TLS handshakes on the HiveMQ Control Center |
|
|
Holds the current amount of cpu cores used |
|
|
Holds the maximum amount of cpu cores allowed by license |
|
|
The total number of declared shared subscription messages that are currently enqueued on the selected node. |
|
|
Measures the rate of inconsequential exceptions thrown during the socket life cycle |
|
|
Measures the current rate of submitted jobs to the ManagedExtensionExecutor |
|
|
Measures the current count of running jobs in the ManagedExtensionExecutor |
|
|
Measures the current rate of completed jobs in the ManagedExtensionExecutor |
|
|
Measures the duration of time spent on submitted jobs to the ManagedExtensionExecutor |
|
|
Measures the current rate of scheduled jobs in the ManagedExtensionExecutor that run once |
|
|
Measures the current rate of scheduled jobs in the ManagedExtensionExecutor that run repetitively |
|
|
Measures the current count of jobs in the ManagedExtensionExecutor that are overrun |
|
|
Measures how many percent of the scheduled period the ManagedExtensionExecutorService jobs lasted |
|
|
Counts the amount of times that the extension service rate limit was exceeded. |
|
|
Counts the amount of publish messages sent by the publish service |
|
|
Counts the amount of publish messages sent by the publish service to a specific client |
|
|
The number of days that remain until the license of the given extension for the selected node expires. |
|
|
Counts every closed connection that was closed because the client missed sending PINGREQ message during the keep-alive interval |
|
|
The number of days that remain until the license of the selected node expires. The default setting (-1) indicates that a valid production license is not yet read or that no valid production license is present and a trial license is in use. |
|
|
The number of CPUs that the cluster currently uses |
|
|
Measures the rate of logging statements of all levels |
|
|
Measures the rate of logging statements in DEBUG level |
|
|
Measures the rate of logging statements in ERROR level |
|
|
Measures the rate of logging statements in INFO level |
|
|
Measures the rate of logging statements in TRACE level |
|
|
Measures the rate of logging statements in WARN level |
|
|
The current number of queued messages for client sessions |
|
|
The current number of pending QoS 0 messages for client sessions |
|
|
The total number of pending messages for client sessions |
|
|
The total number of dead messages the broker detects |
|
|
The number of $dead messages that are queued to a $dead topic |
|
|
The number of $dead messages that are dead more than once |
|
|
The number of $dead messages that are dropped |
|
|
The number of $dead messages that are expired |
|
|
The number of PUBLISH messages that dropped because the message queue for a consumer topic was full |
|
|
The total number of dropped messages on the broker |
|
|
The number of PUBLISH messages that dropped because a Publish Inbound Interceptor prevented onward delivery |
|
|
The number of PUBLISH messages that dropped because of an internal error |
|
|
The number of PUBLISH messages that dropped because the message size was too large for the client |
|
|
The number of MQTT messages (excluding PUBLISH packets) that dropped because the message size was too large for the client |
|
|
The number of PUBLISH messages that dropped because the socket for the client was not writable (QoS 0 only) |
|
|
The number of PUBLISH messages that dropped because a policy prevented onward delivery |
|
|
The number of PUBLISH messages that dropped because the global memory limit for QoS 0 messages was exceeded |
|
|
The number of PUBLISH messages that dropped because the message queue for a disconnected persistent session client was full |
|
|
The current rate of dropped messages |
|
|
The number of PUBLISH messages that are dropped because the message queue for a shared subscription is full |
|
|
The number of $dropped messages that are dead |
|
|
The number of $dropped messages that dropped due to queue limits |
|
|
The number of $dropped messages that originate from clients |
|
|
The number of $dropped messages that originate from shared subscriptions |
|
|
The number $dropped messages that originate from consumers |
|
|
The number of $dropped messages that are enqueued for a $dropped topic |
|
|
The current size of the expired messages cache |
|
|
The number of times an expired message is not added to the expired message cache due to a full cache |
|
|
The total number of expired messages on the broker |
|
|
The number of $expired messages that are dead |
|
|
The number of $expired messages that are dropped due to queue limits |
|
|
The number of $expired messages that expire more than once |
|
|
The number of expired messages that are enqueued for an $expired topic |
|
|
Counts every incoming MQTT CONNECT message |
|
|
Counts every incoming MQTT 3 CONNECT message |
|
|
Counts every incoming MQTT 5 CONNECT message |
|
|
Measures the current rate of incoming MQTT CONNECT messages |
|
|
Counts every incoming MQTT PINGREQ message |
|
|
Measures the current rate of incoming MQTT PINGREQ messages |
|
|
Counts every incoming MQTT PUBACK message |
|
|
Measures the current rate of incoming MQTT PUBACK messages |
|
|
Counts every incoming MQTT PUBCOMP message |
|
|
Measures the current rate of incoming MQTT PUBCOMP messages |
|
|
Measures the distribution of incoming MQTT message size (including MQTT packet headers) |
|
|
Counts every incoming MQTT PUBLISH message |
|
|
Counts every incoming MQTT PUBLISH message that is sent with quality of service (QoS) level 0 |
|
|
Counts every incoming MQTT PUBLISH message that is sent with quality of service (QoS) level 1 |
|
|
Counts every incoming MQTT PUBLISH message that is sent with quality of service (QoS) level 2 |
|
|
Measures the current rate of incoming MQTT PUBLISH messages |
|
|
Counts every incoming MQTT PUBREC message |
|
|
Measures the current rate of incoming MQTT PUBREC messages |
|
|
Counts every incoming MQTT PUBREL message |
|
|
Measures the current rate of incoming MQTT PUBREL messages |
|
|
Counts every incoming MQTT SUBSCRIBE message |
|
|
Measures the current rate of incoming MQTT SUBSCRIBE messages |
|
|
Measures the size distribution of incoming MQTT messages (including MQTT packet headers) |
|
|
Counts every incoming MQTT message |
|
|
Measures the current rate of incoming MQTT messages |
|
|
Counts every incoming MQTT UNSUBSCRIBE message |
|
|
Measures the current rate of incoming MQTT UNSUBSCRIBE messages |
|
|
Counts every incoming MQTT DISCONNECT message |
|
|
Measures the current rate of incoming MQTT DISCONNECT messages |
|
|
Counts every incoming MQTT AUTH message |
|
|
Measures the current rate of incoming MQTT AUTH messages |
|
|
Counts every outgoing MQTT CONNACK message |
|
|
Measures the current rate of outgoing MQTT CONNACK messages |
|
|
Counts every outgoing MQTT PINGRESP message |
|
|
Measures the current rate of outgoing MQTT PINGRESP messages |
|
|
Counts every outgoing MQTT PUBACK message |
|
|
Measures the current rate of outgoing MQTT PUBACK messages |
|
|
Counts every outgoing MQTT PUBCOMP message |
|
|
Measures the current rate of outgoing MQTT PUBCOMP messages |
|
|
Measures the size distribution of outgoing MQTT messages (including MQTT packet headers) |
|
|
Counts every outgoing MQTT PUBLISH message |
|
|
Counts every outgoing MQTT PUBLISH message that is sent with quality of service (QoS) level 0 |
|
|
Counts every outgoing MQTT PUBLISH message that is sent with quality of service (QoS) level 1 |
|
|
Counts every outgoing MQTT PUBLISH message that is sent with quality of service (QoS) level 2 |
|
|
Measures the current rate of outgoing MQTT PUBLISH messages |
|
|
Counts every outgoing MQTT PUBREC message |
|
|
Measures the current rate of outgoing MQTT PUBREC messages |
|
|
Counts every outgoing MQTT PUBREL message |
|
|
Measures the current rate of outgoing MQTT PUBREL messages |
|
|
Counts every outgoing MQTT SUBACK message |
|
|
Measures the current rate of outgoing MQTT SUBACK messages |
|
|
Measures the size distribution of outgoing MQTT messages (including MQTT packet headers) |
|
|
Counts every outgoing MQTT message |
|
|
Measures the current rate of outgoing MQTT messages |
|
|
Counts every outgoing MQTT UNSUBACK message |
|
|
Measures the current rate of outgoing MQTT UNSUBACK messages |
|
|
Counts every outgoing MQTT DISCONNECT message |
|
|
Measures the current rate of outgoing MQTT DISCONNECT messages |
|
|
Counts every outgoing MQTT AUTH message |
|
|
Measures the current rate of outgoing MQTT AUTH messages |
|
|
The current number of pending qos 0 messages |
|
|
The current number of pending messages total |
|
|
Measures the current rate of resent PUBLISH messages (QoS > 0) |
|
|
Measures the current rate of resent PUBREL messages (OoS = 2) |
|
|
The current number of queued messages |
|
|
The current number of queued retained messages |
|
|
The current number of pending retained messages total |
|
|
The current amount of retained messages |
|
|
Metrics about the mean payload-size of retained messages in bytes |
|
|
The current rate of newly retained messages |
|
|
The current number of queued messages for shared subscriptions |
|
|
The current number of pending QoS 0 messages for shared subscriptions |
|
|
The total number of pending messages for shared subscriptions |
|
|
The current number of stored Last Will messages. |
|
|
The current number of stored Last Will messages that are pending send out due to a Will delay that has not elapsed. |
|
|
The total number of published Last Will messages. |
|
|
The current (last 5 seconds) amount of read bytes |
|
|
The total amount of read bytes |
|
|
The current (last 5 seconds) amount of written bytes |
|
|
Total amount of written bytes |
|
|
The current total number of active MQTT connections |
|
|
The mean total number of active MQTT connections |
|
|
Counts clients which disconnected after sending a DISCONNECT Message |
|
|
Counts denied client connections due to exceeded connection rate limits |
|
|
Counts all clients which disconnected from HiveMQ (= graceful + ungraceful) |
|
|
Counts clients which disconnected without sending a DISCONNECT Message |
|
|
Holds the current level of overload protection |
|
|
Holds the current amount of credits a client receives per tick |
|
|
Holds the average amount of available credits between all clients |
|
|
Holds the current amount of clients having less than the full amount of credits |
|
|
Holds the current amount of clients for which backpressure is applied by overload protection |
|
|
Measure the rate of completed tasks submitted to the scheduler in charge of the cleanup of the persistence payload |
|
|
Captures metrics about the job durations for jobs submitted to the scheduler in charge of the cleanup of the persistence payload |
|
|
Counts tasks that are currently running in the scheduler in charge of the cleanup of the persistence payload |
|
|
Measures about the tasks that have been scheduled to run only once in the scheduler in charge of the cleanup of the persistence payload |
|
|
Counts the periodic tasks that ran longer than their time frame allowed in the scheduler in charge of the cleanup of the persistence payload |
|
|
Metrics about how much percent of their allowed time frame periodic tasks used while running the cleanup of the persistence payload |
|
|
Measures about the tasks that have been scheduled to run repetitively in the scheduler in charge of the cleanup of the persistence payload |
|
|
Measures about the tasks that have been submitted to the scheduler in charge of the cleanup of the persistence payload |
|
|
Measures the size of the largest queue with attribute persistence disk I/O tasks |
|
|
Measures the size of the largest queue with disk I/O tasks in the client events persistence executor |
|
|
Measures the size of the largest queue with disk I/O tasks in the client session persistence executor |
|
|
The current number of disk I/O tasks in the queue of the client-session persistence executor |
|
|
The mean execution time in nanoseconds HiveMQ currently requires to process client event tasks |
|
|
The current number of disk I/O tasks in the queue of the client-events persistence executor |
|
|
Measures the mean execution time (in nanoseconds) of client events tasks |
|
|
Measure the rate of completed tasks submitted to the persistence executor |
|
|
Captures metrics about the job durations for jobs submitted to the persistence executor |
|
|
Measures the size of the largest queue with incoming message flow persistence disk I/O tasks |
|
|
Current amount of single writer task queues that are not empty |
|
|
Current amount of disk I/O tasks that are enqueued by the outgoing message flow persistence |
|
|
Measures the mean execution time (in nanoseconds) of outgoing message flow disk I/O tasks |
|
|
Current count of loops that all single writer threads have done without executing a task |
|
|
Measures the size of the largest queue with queued messages persistence disk I/O tasks |
|
|
Current amount of disk I/O tasks that are enqueued by the queued messages persistence |
|
|
Measures the mean execution time (in nanoseconds) of queued messages disk I/O tasks |
|
|
Measures the size of the largest queue with request event bus persistence tasks |
|
|
Current amount of tasks that are enqueued by the request event bus |
|
|
Measures the mean execution time (in nanoseconds) of request event bus tasks |
|
|
Measures the size of the largest queue with retained message persistence disk I/O tasks |
|
|
Current amount of disk I/O tasks that are enqueued by the retained message persistence |
|
|
Measures the mean execution time (in nanoseconds) of retained message disk I/O tasks |
|
|
Counts tasks that are currently running in the persistence executor |
|
|
Current amount of threads that are executing disk I/O tasks |
|
|
Measures about the tasks that have been submitted to the scheduler responsible for persistence |
|
|
Measures the size of the largest queue with subscription persistence disk I/O tasks |
|
|
Current amount of disk I/O tasks that are enqueued by the subscription persistence |
|
|
Measures the mean execution time (in nanoseconds) of subscription disk I/O tasks |
|
|
Measures the size of the largest queue with topic tree persistence disk I/O tasks |
|
|
Current amount of disk I/O tasks that are enqueued by all persistence executors |
|
|
Holds the current amount of payloads stored in the payload persistence |
|
|
Holds the current amount of payloads stored in the payload persistence, that can be removed by the cleanup |
|
|
Measure the rate of completed tasks submitted to the scheduler responsible for persistence |
|
|
Captures metrics about the job durations for jobs submitted to the scheduler responsible for persistence |
|
|
Counts tasks that are currently running in the scheduler responsible for persistence |
|
|
Measures about the tasks that have been scheduled to run once in the scheduler responsible for persistence |
|
|
Counts the periodic tasks which ran longer than their time frame allowed in the scheduler responsible for persistence |
|
|
Metrics about how much percent of their allowed time frame periodic tasks used in the scheduler responsible for persistence |
|
|
Measures about the tasks that have been scheduled to run repetitively in the scheduler responsible for persistence |
|
|
Measures about the tasks that have been submitted to the scheduler responsible for persistence |
|
|
Counts the amount of publish messages received, without any matching subscribers |
|
|
Holds the current amount of bytes QoS 0 messages use in memory |
|
|
Holds the maximum amount of bytes QoS 0 messages may use in memory |
|
|
Holds the current amount of clients that exceeded their QoS 0 message memory |
|
|
Holds the current amount of cpu cores used |
|
|
Holds the maximum amount of cpu cores allowed by license |
|
|
The current number of stored sessions. These sessions include all sessions, including online and offline clients |
|
|
The current number of active persistent sessions (= Online MQTT clients which are connected with cleanSession=false) |
|
|
The rate of completed tasks submitted to the single-writer executor |
|
|
The rate of completed tasks submitted to the scheduler responsible for single-writer |
|
|
The current number of tasks running in the scheduler responsible for single-writer |
|
|
The rate of tasks submitted to the scheduler responsible for single-writer |
|
|
The current number of subscriptions on the broker |
|
|
The current number of shared subscriptions on the broker |
|
|
The total number of TLS handshakes that started |
|
|
The total number of TLS handshakes that succeeded |
|
|
The total number of TLS handshakes that failed |
|
|
The total number of TLS handshakes that are currently in progress |
|
|
Measures the mean execution time of tombstone cleanup jobs in nanoseconds |
|
|
Holds the current amount of bytes topic aliases use in memory |
|
|
Holds the current amount of topic aliases |
| Metric | Type | Description |
|---|---|---|
|
|
Maximum allowed amount of file descriptors as seen by the JVM |
|
|
Amount of open file descriptors as seen by the JVM |
|
|
Current amount of free physical memory in bytes |
|
|
Total amount of physical memory (bytes) available |
|
|
Current CPU usage for the JVM process (0.0 idle – 1.0 full CPU usage) |
|
|
Total amount of CPU time the JVM process has used to this point(in nanoseconds) |
|
|
The total number of failed sanity checks |
|
|
Current amount of free swap space in bytes |
|
|
Total amount of swap space available in bytes |
|
|
Current CPU usage for the whole system (0.0 idle – 1.0 full CPU usage) |
|
|
The total amount of free disk space on disk |
|
|
The total size of disk |
|
|
The current number of read operations for the disk |
|
|
The current number of write operations for the disk |
|
|
The current number bytes read from the disk |
|
|
The current number of bytes written from the disk |
|
|
The number of pending I/O requests in the disk queue |
|
|
The time spent reading or writing, in milliseconds |
|
|
Amount of currently open file descriptors |
|
|
Maximum allowed amount of file descriptors |
|
|
OS Uptime in seconds |
|
|
The amount of actual physical memory, in bytes |
|
|
The amount of physical memory currently available, in bytes |
|
|
The current memory committed to the paging/swap file(s), in bytes |
|
|
The current size of the paging/swap file(s), in bytes |
|
|
Percentage of time that the CPU or CPUs were idle and the system did not have an outstanding disk I/O request |
|
|
Percentage of time that the CPU or CPUs were idle during which the system had an outstanding disk I/O request |
|
|
Percentage of time that the CPU used to service hardware IRQs |
|
|
Percentage of CPU utilization that occurred while executing at the user level with nice priority |
|
|
Percentage of time that the CPU used to service soft IRQs |
|
|
Percentage of time which the hypervisor dedicated for other guests in the system. |
|
|
Percentage of CPU utilization that occurred while executing at the system level (kernel) |
|
|
Percentage of CPU utilization that occurred while executing at the user level (application) |
|
|
Percentage of total CPU utilization for convenience (not idle, calculated as sum of usage values) |
|
|
Bytes received by the network interface |
|
|
Bytes sent by the network interface |
|
|
Packets sent by the network interface |
|
|
Packets received by the network interface |
|
|
Input errors for the network interface |
|
|
Output errors for the network interface |
|
|
The current number of packets for which collision occurred |
|
|
The current number of incoming/received packets that were dropped |
|
|
The current number of context switches in the HiveMQ process |
|
|
The current process-specific hard open file limit that applies to HiveMQ |
|
|
The current process-specific soft open file limit that applies to HiveMQ |
|
|
The current number of major page faults in the HiveMQ process |
|
|
The current number of minor page faults in the HiveMQ process |
|
|
The current number of failed IPv4 connections |
|
|
The current number of IPv4 errors received |
|
|
The current number of IPv4 segments transmitted with the reset flag set |
|
|
The current number of reset IPv4 connections |
|
|
The current number of failed IPv6 connections |
|
|
The current number of errors received |
|
|
The current number of IPv6 segments transmitted with the reset flag set |
|
|
The current number of reset IPv6 connections |
|
|
The current number of received UDP4 datagrams on a port that is not listened to |
|
|
The current number of received UDP4 datagrams that could not be delivered to an application |
|
|
The current number of received UDP6 datagrams on a port that is not listened to. |
|
|
The current number of received UDP datagrams that could not be delivered to an application |
|
|
Number of bytes the HiveMQ process has written to disk |
|
|
Number of bytes the HiveMQ process has read from disk |
|
|
Virtual Memory Size (VSZ) in bytes. It includes all memory that the HiveMQ process can access, including memory that is swapped out and memory that is from shared libraries |
|
|
Resident Set Size (RSS) in bytes. It is used to show how much memory is allocated to the HiveMQ process and is in RAM. It does not include memory that is swapped out. It does include memory from shared libraries as long as the pages from those libraries are actually in memory. It does include all stack and heap memory |
|
|
Number of threads of the HiveMQ process as seen by the OS |
|
|
Amount of milliseconds the HiveMQ process has executed in user mode as seen by the OS |
|
|
Amount of milliseconds the HiveMQ process has executed in kernel/system mode as seen by the OS |
|
|
HiveMQ process uptime in milliseconds |
The following table lists all metrics that are specific to the Java Virtual Machine.
| Metric | Type | Description |
|---|---|---|
|
|
The JVMs capacity of direct buffers |
|
|
The count of direct buffers in the JVM |
|
|
The amount of used direct buffers in the JVM |
|
|
The JVMs capacity of mapped buffers |
|
|
The count of mapped buffers in the JVM |
|
|
The amount of used mapped buffers in the JVM |
|
|
The total number of classes that have been loaded since the JVM has started execution |
|
|
The total number of classes unloaded since the JVM has started execution |
|
|
Amount of file descriptors as seen by the JVM |
|
|
The total amount of collections that occurred |
|
|
The approximate accumulated collection elapsed time |
|
|
The total amount of collections that occurred |
|
|
The approximate accumulated collection elapsed time |
|
|
The amount of memory in bytes that is committed for the JVM to use |
|
|
The amount of memory in bytes that the JVM initially requests from the operating system for memory management. The value of this metric can be |
|
|
The maximum amount of memory in bytes that can be used for memory management. The value of this metric can be |
|
|
The ratio of used memory and unused memory |
|
|
The amount of used memory in bytes |
|
|
The amount of memory in bytes that is committed for the Java virtual machine to use |
|
|
The amount of memory in bytes that the JVM initially requests from the operating system for memory management. The value of this metric can be |
|
|
The maximum amount of memory in bytes that can be used for memory management. The value of this metric can be |
|
|
The ratio of used memory and unused memory |
|
|
The amount of used memory in bytes |
|
|
The amount of memory in bytes that is committed for the JVM to use in this memory pool |
|
|
The amount of memory in bytes that the JVM initially requests from the operating system for memory pool. The value of this metric can be |
|
|
The maximum amount of memory in bytes that can be used for this memory pool. The value of this metric can be |
|
|
An estimate of the memory usage of this memory pool |
|
|
The amount of used memory in this memory pool in bytes |
|
|
The amount of memory usage int this memory pool after the last garbage collection |
|
|
The amount of memory in bytes that is committed for the Java virtual machine to use |
|
|
The amount of memory in bytes that the JVM initially requests from the operating system for memory management. The value of this metric can be |
|
|
The maximum amount of memory in bytes that can be used for memory management. The value of this metric can be |
|
|
The amount of used memory in bytes |
|
|
The amount of blocked threads in this JVM |
|
|
The total amount of threads in this JVM |
|
|
The amount of daemon threads in this JVM |
|
|
The amount of detected deadlocks in this JVM |
|
|
The amount of detected deadlocks in this JVM |
|
|
The amount of new threads in this JVM |
|
|
The amount of runnable threads in this JVM |
|
|
The amount of terminated threads in this JVM |
|
|
The amount of timed-waiting threads in this JVM |
|
|
The amount of waiting threads in this JVM |
The following HiveMQ metrics are only available for HiveMQ server instances that are part of a cluster:
| Metric | Type | Description |
|---|---|---|
|
|
Provides measures for every class that made once a SEND request (every class get its own metric) |
HiveMQ REST API Metrics
When enabled, the HiveMQ REST API exposes the following metrics:
| Metric | Type | Description |
|---|---|---|
|
|
The number of REST API dispatches that are currently active |
|
|
The number of REST API requests that are currently active |
|
|
The number of REST API requests that are currently suspended |
|
|
The rate of asynchronous REST API dispatches |
|
|
The rate of asynchronous REST API timeouts |
|
|
The total number of failed REST API authentication attempts |
|
|
The total number of successful REST API authentication attempts |
|
|
The total number of failed REST API authorization attempts |
|
|
The total number of successful REST API authorization attempts |
|
|
Captures rate and duration information for REST API dispatches |
|
|
Captures rate and duration information for backup information requests |
|
|
Captures rate and duration information for requests to list all available backups |
|
|
Captures rate and duration information for requests to restore a backup |
|
|
Captures rate and duration information for requests to create a new backup |
|
|
Captures rate and duration information for requests to download a backup file |
|
|
Captures rate and duration information for requests to download a trace recording |
|
|
Captures rate and duration information for requests to get all trace recordings |
|
|
Captures rate and duration information of requests to delete a trace recording |
|
|
Captures rate and duration information requests to stop a trace recording |
|
|
Captures rate and duration information for requests to create a trace recording |
|
|
Captures rate and duration information for requests to list all MQTT clients |
|
|
Captures rate and duration information for client connection status requests |
|
|
Captures rate and duration information for detailed client information requests |
|
|
Captures rate and duration information for requests to list all subscriptions for MQTT client |
|
|
Captures rate and duration information for HiveMQ REST API requests |
|
|
The number of failed TLS handshakes for the HiveMQ REST API |
|
|
The number of successful TLS handshakes for the HiveMQ REST API |
|
|
The rate of HTTP response codes in the 100-199 range |
|
|
The rate of HTTP response codes in the 200-299 range |
|
|
The rate of HTTP response codes in the 300-399 range |
|
|
The rate of HTTP response codes in the 400-499 range |
|
|
The rate of HTTP response codes in the 500-599 range |