Available Control Center Information
The pages of the HiveMQ Control Center have a consistent look and feel. The top of each page provides the title of the page, the username of the person who is currently logged in, and a Log out option.
The version number of the HiveMQ version that you are currently running appears below the side navigation. Please keep the version information on hand when you contact our support.
To view more information about an item in the control center, select the question mark (?) next to the desired item.
By default, the control center contains the following pages:
| Page | Description |
|---|---|
Shows the current status of HiveMQ and each node in the HiveMQ cluster (including notifications, license information, and key metrics) |
|
Overview of all available clients with links to further client details |
|
Overview of all available shared subscriptions with links to further shared subscription details |
|
Overview of all extension consumers with current queue level per topic for each. |
|
Overview of all available retained messages with links to further retained message details |
|
Overview of all available data and behavior policies with visualizations of current data pipeline quality and an interactive user interface for management of your Data Hub deployment |
|
Overview of all active and inactive HiveMQ licenses that are associated with the HiveMQ installation with links to further active license details |
|
Overview of all current trace recordings, with links to create and manage trace recordings |
|
Detailed information on dropped messages |
|
Overview of all stored backups with actions to create a backup or restore from an existing backup. |
|
Opens a page where you can generate a diagnostic archive that collects all relevant information about the current state of your HiveMQ cluster. |
| HiveMQ Enterprise Extensions add additional pages and features to your control center. For more information, see HiveMQ Enterprise Extensions. |
Dashboard
The dashboard of the control center provides a clear overview of the current state of HiveMQ and your entire cluster. This information gives you immediate insights on key issues and allows you to quickly check the state of each available cluster node.
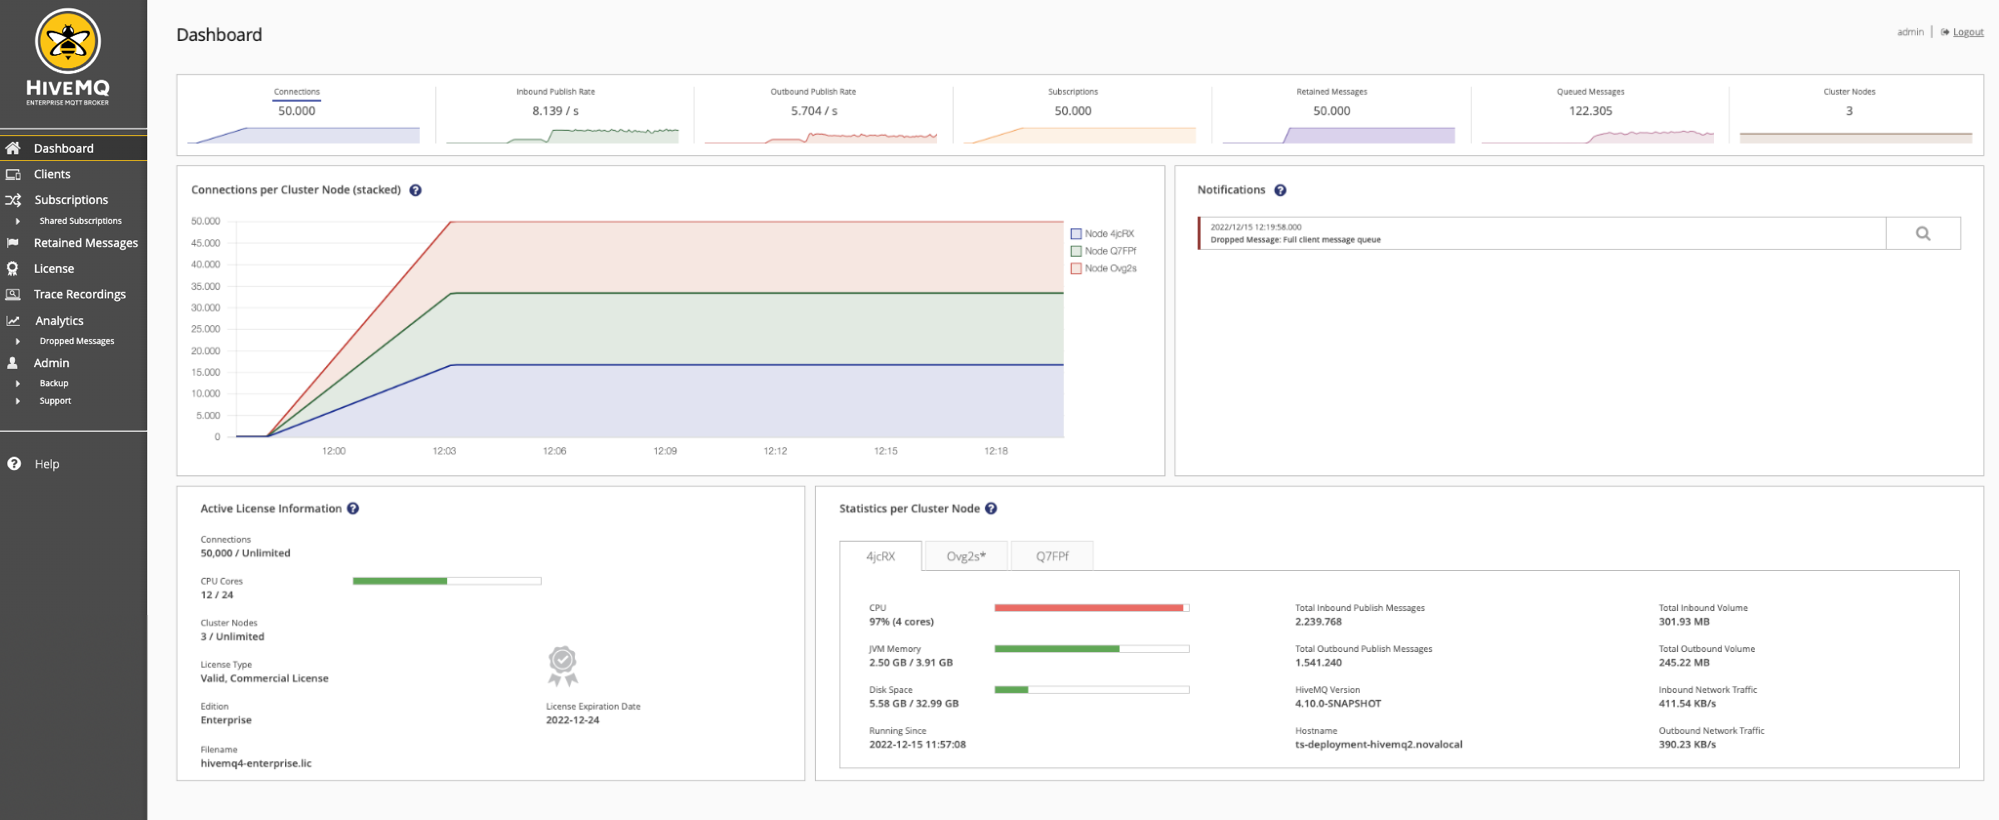
At the top of the dashboard, an overview bar shows you key metrics such as the current usage and throughput of the cluster at a glance. For more information on a specific metric, select the metric in the overview bar to open a detail view.
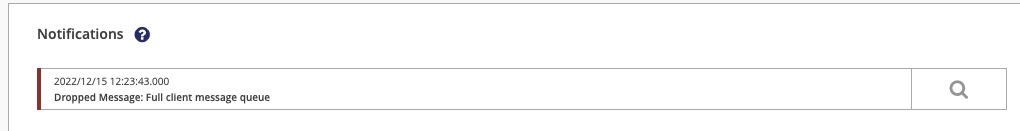
Notifications
The Notifications area of your dashboard displays useful information and alerts. For example, information if a client drops a message. An alert does not necessarily mean that something is wrong. However, an alert can indicate that an unwanted behaviour has occurred.
Example notification area with connection-limit alert:
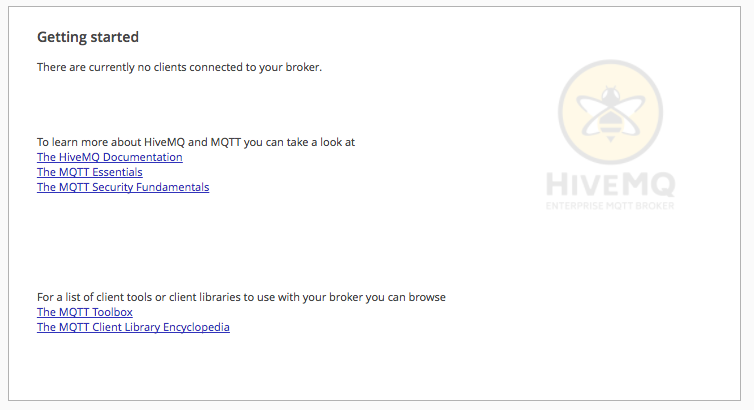
Example notification area with no connected clients that displays useful links:
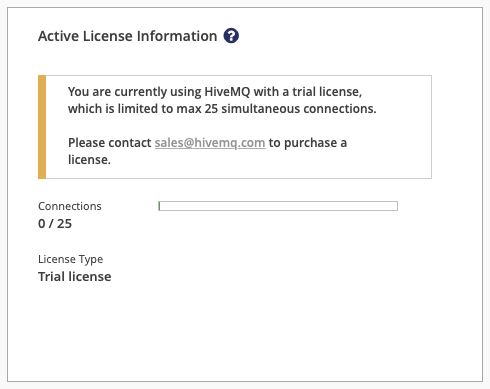
Active License Information
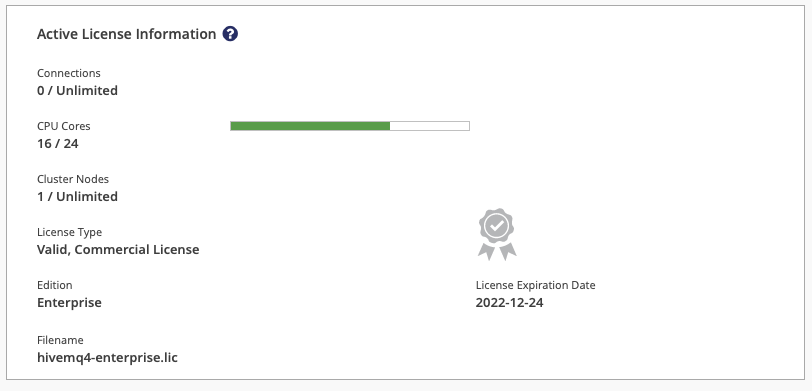
The Active License Information card on your control center dashboard displays key information about the HiveMQ license that is currently in use.
| For detailed information on all licenses associated with your HiveMQ installation and the features your active license enables, open the License view from the main navigation. For more information, see Licenses. |
| Item | Description |
|---|---|
Connections |
The number of client connections currently in use and the maximum number of concurrent connections the active license allows. |
CPU Cores |
The number of CPU cores currently in use and the maximum number of cores the active license supports. |
License Type |
The validity status and the type of license (for example, Trial License or valid, commercial license). |
Edition |
The variant for which the license is valid. HiveMQ. For more information, see HiveMQ Editions. |
Filename |
The filename of the license that is currently in use. |
License Expiration Date |
Expiration date of the license that is currently in use. |
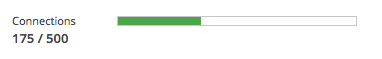
Based on the maximum number CPU cores the active licence allows, the cores status bar shows the current CPU capacity of the selected node:
A green bar indicates that less than 75% of the CPU cores that the active license allows are in use.
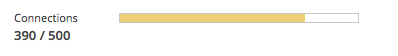
A yellow bar indicates that more than 75% of the CPU cores that the active license allows are in use.
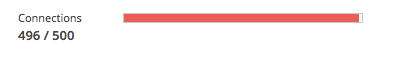
A red bar indicates that more than 90% of the CPU cores that the active license allows are in use.
| If no valid license is available in the licence folder of your HiveMQ installation, a trial license is used automatically. Trial licenses are limited to 25 concurrent connections and not intended for production use. For more information, see Trial license. |
Cluster Node Statistics
The statistics area of your control center dashboard shows information for each individual node in your cluster. Nodes are identified with a randomly-generated cluster node ID. An asterisk (*) after the cluster node ID indicates the node that is used for the HiveMQ control-center connection.
To view statistics for a node, select the node ID.
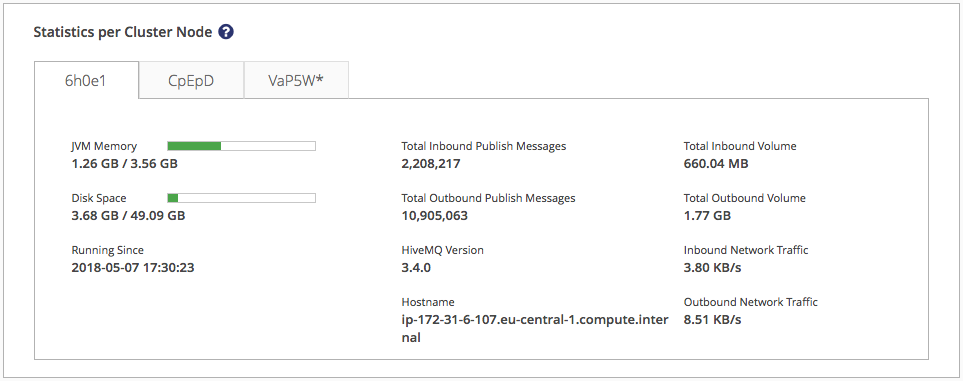
The following metrics are available for each node in the cluster:
| Metric | Description |
|---|---|
|
The amount of the JVM-memory heap space that is in use and the total amount that is available |
|
The amount of disk space where the HiveMQ data folder is located that is in use and the total amount that is available |
|
The startup time of the selected node |
|
The total number of inbound publish messages |
|
The total number of outbound publish messages |
|
The HiveMQ version the selected node runs |
|
The network hostname of the selected node |
|
The total volume of inbound MQTT messages in bytes |
|
The total volume of outbound MQTT messages in bytes |
|
The amount of inbound MQTT messages per second |
|
The amount of outbound MQTT messages per second |
Clients
With millions of connected clients, keeping track of specific clients can become a challenge. The HiveMQ Control Center provides tools to list, view, and manage all the MQTT clients known to HiveMQ. Information about subscriptions, connection status, TLS, and more offer detailed insights into every client.
Clients Overview
HiveMQ uses cluster-wide snapshots to display all available MQTT sessions. To view information for the MQTT sessions that are currently available, you need to create a fresh snapshot. The HiveMQ snapshot offers a consolidated view of all nodes in your cluster at a particular point in time. This unified snapshot provides an efficient way to sort, filter, and navigate through all available MQTT sessions.
To create a snapshot, select Refresh Snapshot. Based on the number of MQTT sessions on your cluster, the refresh process can take a few moments. When the process finishes, an overview table of the current clients displays.
To change the order in which clients are sorted on the overview, click the column header.
To filter clients by client ID, username, or IP address, select the desired option from the drop-down menus in the Clean Session and Connected columns.
The sorting options and filters that you apply to the Clients overview table are stored until you log out.
If you leave the Clients overview and return later, the filters and sorting options that you applied to the overview table remain active.
| Snapshots do not update automatically. To manually refresh the data that is shown in the Clients overview, select Refresh Snapshot. |

| Column | Description |
|---|---|
Client ID |
The unique identifier of the client. |
Connected |
Shows whether a client is currently connected.
|
Queue Size |
The current and maximum number of messages in the message queue of the client.
|
Username |
The username of the client. When blank, no username was set. |
IP Address |
The IP address of the client. |
To open the Client Detail page of a client and access additional client actions, select the identifier of the client on the overview.
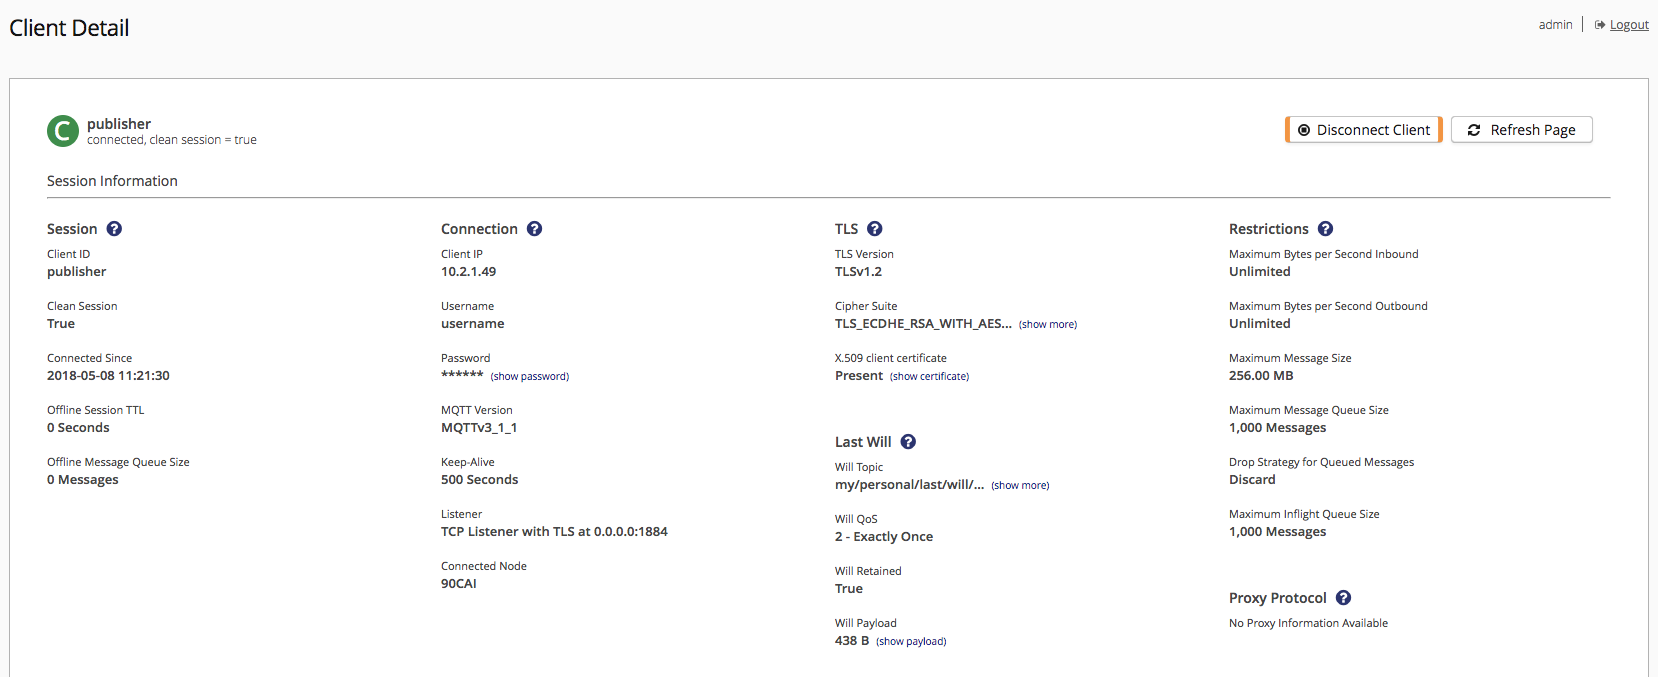
Client Details
This page displays when you select a client identifier in the Clients overview.
The client identifier and the connection status of the client for which details are shown appears at the top of the page.
The Prev and Next options on your client detail pages allow you to easily navigate through the clients on your Clients overview.
Prev displays information for the client one row before the currently selected entry in the overview table.
Next displays information for the client one row after the currently selected entry in the overview table.
If you change the sorting order or filters of your Clients overview table, the changes that you make are immediately reflected in the Prev and Next information.
To view more information about each item that is shown on the details page, select the question mark next to the desired column.
For example, more information on sessions:
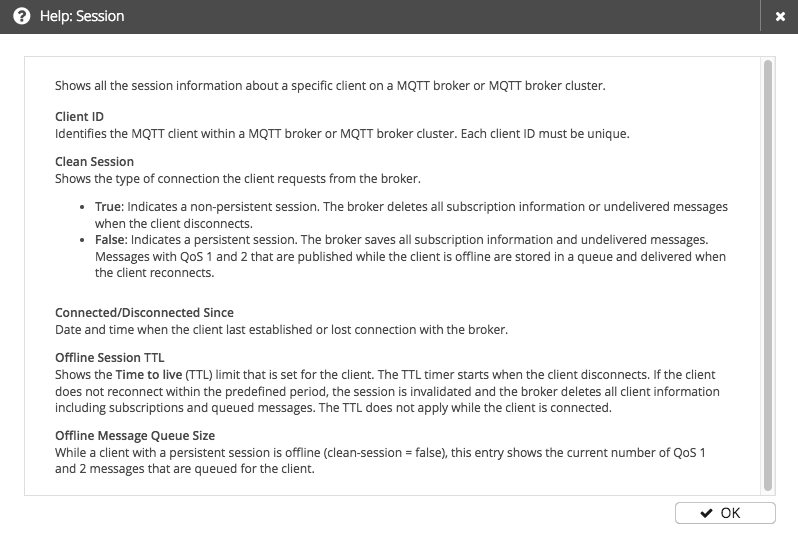
Session
When a client connects to an MQTT broker, the client subscribes to each topic for which it wants to receive messages from the broker. If the client connects to the MQTT broker with a non-persistent session, the broker does not save any subscription information when the client disconnects. In a non-persistent session, each time the client reconnects to the MQTT broker, the client must resubscribe to each topic of interest.
In a persistent session, the MQTT broker saves all relevant client information. The session is identified by the client ID that the client provides during connection establishment.
For more information, see MQTT Essentials: Persistent Session and Queuing Messages.
The following information is stored in the session:
| Item | Description |
|---|---|
Client ID |
Identifies the MQTT client within an MQTT broker or MQTT broker cluster. |
Clean Session |
If set to true, sessions are stateless. Information such as unfinished message flows and subscriptions is lost on disconnect. |
Connected/Disconnected Since |
Date and time when the client last established or lost connection with the broker. |
Offline Session TTL |
Shows the Time to live (TTL) limit that is set for the client. The TTL timer starts when the client disconnects. If the client does not reconnect within the predefined period, the session is invalidated and the broker deletes all client information (including subscriptions and queued messages). The TTL does not apply while the client is connected |
Offline Message Queue Size |
When a client with a persistent session is offline (session-expiry-interval > 0), this entry shows the current number of QoS 1 and 2 messages that are queued for the client. |
Connection
A central principle of MQTT is the decoupling of communication partners.
Decoupling means that the clients that send and receive the MQTT messages only connect to the MQTT broker.
One MQTT client never connects directly to another MQTT client.
To establish an MQTT connection, the client sends a CONNECT message to the HiveMQ broker and the HiveMQ broker replies to the client with a CONNACK message.
The protocol the HiveMQ broker uses for the connection is TCP.
For more information, see HiveMQ Essentials: Client, Broker, and Connection Establishment and MQTT Essentials: Keep Alive and Client Take-Over.
The Client Detail page provides the following connection information for the client that is currently selected on the overview:
| Item | Description |
|---|---|
Client IP |
The network IP address of the client. The address can be IPv4 or IPv6. |
Username |
Username of the selected client. |
Password |
Password of the selected client. |
MQTT Version |
The version number of the MQTT protocol that is used for the connection. |
Keep-Alive |
Interval during which the client is required to send control packets. If the client fails to send a packet within the defined interval, the broker disconnects the client. |
Listener |
The type of listener and the address the client uses to connect to the broker. |
Connected Node |
The unique identifier of the cluster node to which the client is connected. |
TLS
Transport Layer Security (TLS) is a cryptographic protocol that allows secure and encrypted communication between a client application and a server at the transport layer.
If a TLS listener is enabled in HiveMQ, each client connection for that listener is encrypted and secured by TLS.
It is also possible to use an X.509 certificate to authenticate the client.
Authentication with an X.509 certificate is an alternative to the username/password authentication.
The TLS column of the Client Details page shows the most important aspects of the TLS that the selected client uses.
For more information, see Transport Layer Security (TLS).
| Item | Description |
|---|---|
TLS Version |
The version of the TLS protocol that is used. |
Cipher Suite |
The cipher suite that is used for the encryption of the connection. The cipher suite is a combination of authentication, encryption, message authentication code (MAC), and key exchange algorithms. |
X.509 client certificate |
The X.509 certificate of the client. |
Information from the X.509 certificate of the client is grouped into two sections:
General
| Item | Description |
|---|---|
Common Name |
Common name of the owner of the certificate |
Organization |
Organization of the subject |
Organizational Unit |
Organizational unit of the subject |
Serial |
Serial number of the certificate |
x.509 Version |
Version of the certificate |
Valid From |
Timestamp from which the certificate is valid |
Valid Until |
Timestamp until which the certificate is valid |
Country |
Country of the subject |
State |
State of the subject |
Last Will
Last will is a feature that is used when a client disconnects ungracefully. The last will of a client publishes a last-will message to a specific topic with a specified Quality of Service upon an ungraceful disconnection.
For more information, see MQTT Essentials: Last Will and Testament.
When a client connects to the broker, the client can specify a last will message. The will message is a normal MQTT message with a topic, QoS, retained flag, and payload.
| Item | Description |
|---|---|
Will Topic |
The topic on which the last will payload is published. |
Will QoS |
The Quality of Service level with which the last will message is published. |
Will Retained |
Indicates whether the last will message is a retained message. |
Will Payload |
The payload that is published when the last will is triggered. |
To view or download the payload of the last will message, select the show payload next to the Will Payload size of the desired payload. The LWT Payload window for the selected last will message opens:
In the LWT Payload window, you can select how the payload is presented.
It is possible to show the payload as a UTF-8 string, hexadecimal value, or binary value.
The Content area of the window shows a preview of the payload in the selected format.
If desired, you can copy the payload content to your clipboard or download the content as a .dat file.
Restrictions
To ensure a trouble-free communication process, some restrictions have to be observed.
| Item | Description |
|---|---|
Maximum Bytes per Second Inbound |
The maximum bytes per second this client can receive from the broker. |
Maximum Bytes per Second Outbound |
The maximum bytes per second this client can send to the broker. |
Maximum Message Size |
The maximum payload size in bytes that MQTT PUBLISH messages sent by this client. |
Maximum Message Queue Size |
The maximum number of messages that the client can store in its message queue on the broker. |
Drop Strategy for Queued Messages |
Defines how the broker manages messages when the message queue limit is reached.
|
Proxy Protocol
HiveMQ supports the PROXY protocol for all listener types. The PROXY protocol is a TCP-based protocol that provides a convenient way to transport client details such as the IP address and port over multiple proxies. If you run your HiveMQ brokers behind a load balancer that proxies the TCP connection, PROXY protocol is helpful. Otherwise, useful client information such as the IP address, port, and SSL information is lost since the broker only recognizes the TCP connection of the load balancer (not of the original client).
For more information, see PROXY protocol.
| Item | Description |
|---|---|
Source IP/Port |
The source (origin) IP address and port of the proxy. |
Destination IP/Port |
The destination IP address and port of the proxy. |
Additional TLVs |
The type-length values (TLVs) are key-value pairs that provide optional information such as the SSL X.509 client certificate common names or the TLS version the client used to connect to the proxy. |
Subscriptions
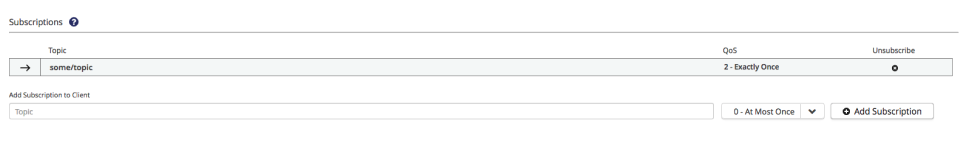
The Client Detail page provides information on the subscriptions and shared subscriptions of each client. On the detail page, you can add and remove subscription and shared subscription topics for the selected client.
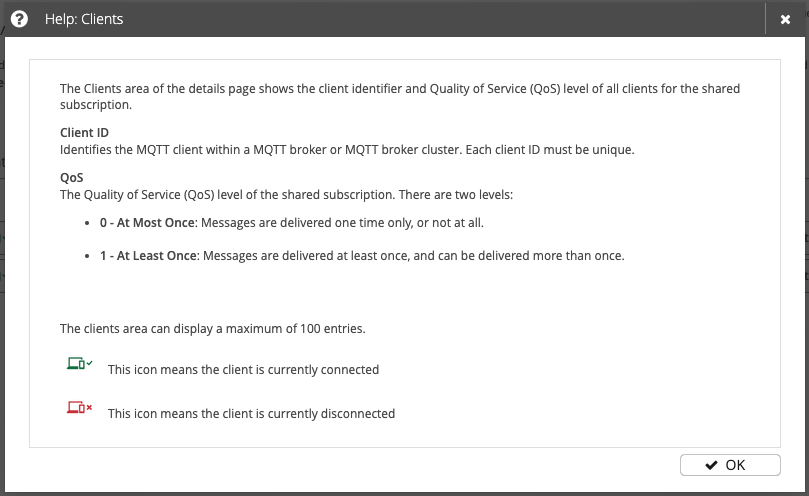
The Subscriptions area shows all topics to which the selected client subscribes. Each subscription consists of a topic and the Quality of Service (QoS) level for the subscription. There are three QoS levels:
-
0 - At Most Once: Messages are delivered one time or not at all.
-
1 - At Least Once: Messages are delivered at least once and can be delivered multiple times.
-
2 - Exactly Once: Message delivery is guaranteed with no duplicates.
Shared Subscriptions
The ability to use shared subscriptions with all versions of MQTT is a unique feature of HiveMQ.
Shared subscriptions allow MQTT clients to share a subscription to the same topic on the broker.
In a "standard" MQTT subscription, each client receives a copy of the message.
Shared subscriptions distribute the message load of the subscribed topic equally among each client in the shared group.
HiveMQ delivers the message to only one subscriber in the group that share the subscription.
This mechanism is sometimes called client load balancing.
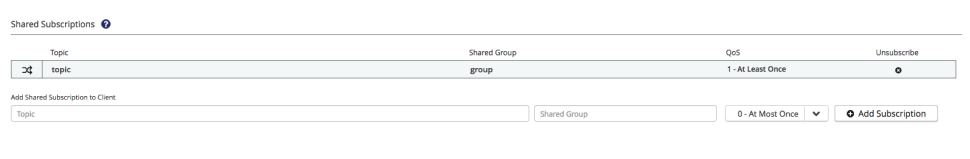
The shared subscription area shows the topic, shared group name, and QoS level of all shared subscriptions of the selected client.
-
To view the shared subscriptions details of a specific shared subscription, select the subscription topic.
-
To unsubscribe the client from a shared subscription, select the x symbol next to the subscription you wish to end.
-
To add new shared subscriptions to the client, enter the topic, shared group, and quality of service level for the desired subscription.
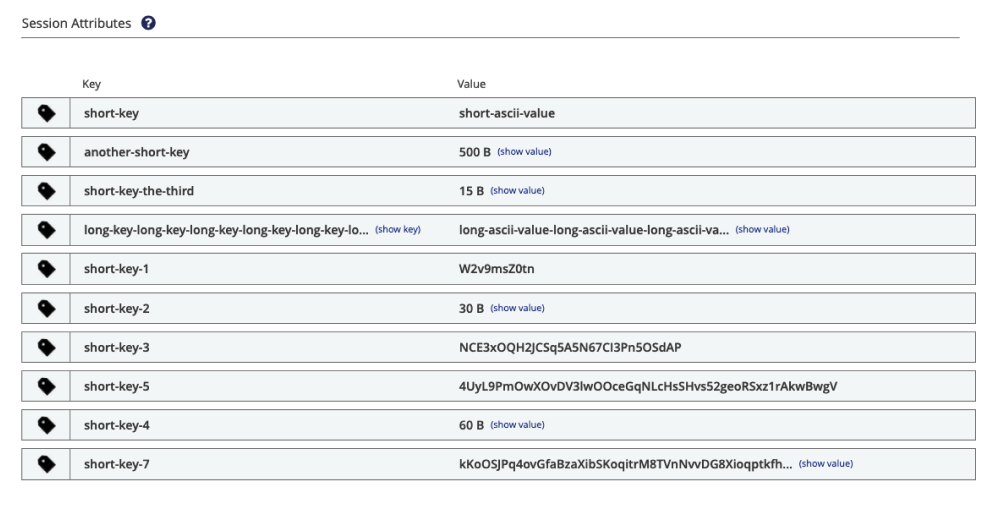
Session Attributes
Session attributes are a convenient way to add additional key-value data to the session of an MQTT client. The Session Attributes area of the Client Detail lists all available session attributes for the selected client. Use the concise control center view to easily review and verify the session attributes of your clients.
Each session attribute contains a key and a value. The Sessions Attributes area can display a maximum of 100 entries.
| Item | Description |
|---|---|
key |
The key of the session attribute. To view, download, or copy the information stored in the key, select show key. In the information dialog that opens you can select how the information is shown. |
value |
The value of the session attribute. If the value contains only ASCII characters, an ASCII string displays. If the value contains non-ASCII characters, the size of the value in bytes is shown. To view, download, or copy the information stored in the value, select show value. In the information dialog that opens you can select how the information is shown. |
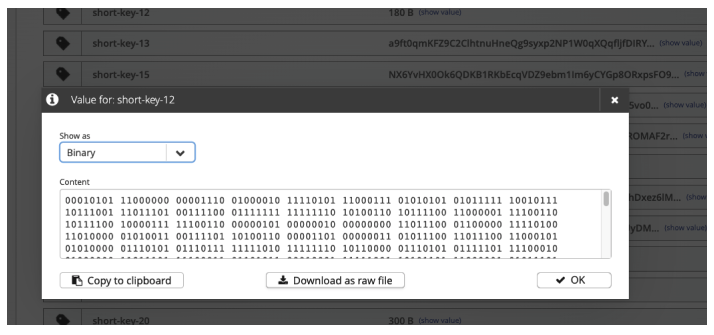
When you select show key or show value for the key or value of a session attribute, you can select how the data is presented. It is possible to show the data as a UTF-8 string, hexadecimal value, or binary value. The Content area of the information dialog shows a preview of the payload in the selected format. If desired, you can copy the session attribute content to your clipboard or download the content as a .dat file.
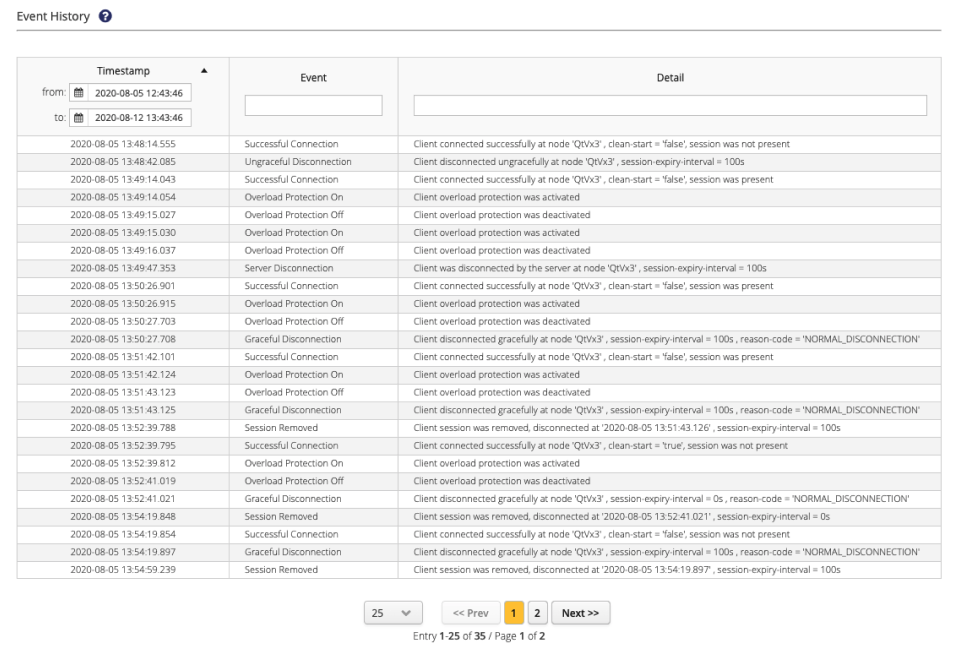
Event History
HiveMQ deployments are built to handle millions of clients and massive amounts of data. The Event History area gives you access to all previous events associated with the selected client. The historical view of client events makes it easier to monitor and analyze the behavior of a specific client over time and diagnose problems.
| You can use the event history integration in the HiveMQ enterprise extension SDK to trigger actions that are based on the event history of a client or to export historical data for further analysis in a third-party tool. |
| Item | Description |
|---|---|
Timestamp |
The UTC timestamp when the event occurred. |
Event |
Shows the type of event that was captured. The following options are available:
|
Details |
Shows additional information for the event:
|
Events can be sorted and filtered by time interval, event type, and event details.
To change the order in which events are sorted, click the column header.
To filter events by type or details, enter your filter criteria in the Event and Details columns. To filter for events in a specific timeframe, use the calendar option in the Timestamp column to define your desired time period.
| The Event History area can display a maximum of 100,000 entries. If the number of events exceeds the display limit, reduce the selected time interval. |
Shared Subscriptions
Shared subscriptions are an effective way to distribute messages across different MQTT subscribers with standard MQTT mechanisms.
This type of subscription lets you add MQTT-client load balancing without any proprietary additions to your MQTT clients.
For more information, see Shared Subscriptions.
The HiveMQ Control Center provides all the information you need to efficiently manage all your shared subscriptions.
| Shared subscriptions can dramatically alleviate cluster traffic and latency for high-scalability deployments. The load-balancing abilities of shared subscriptions are especially useful for backend systems or high-traffic topics that can quickly overwhelm a single MQTT client. Shared subscriptions are the recommended way to connect horizontally scaling backend systems with HiveMQ. For more information see, MQTT Client Load Balancing with Shared Subscriptions. |
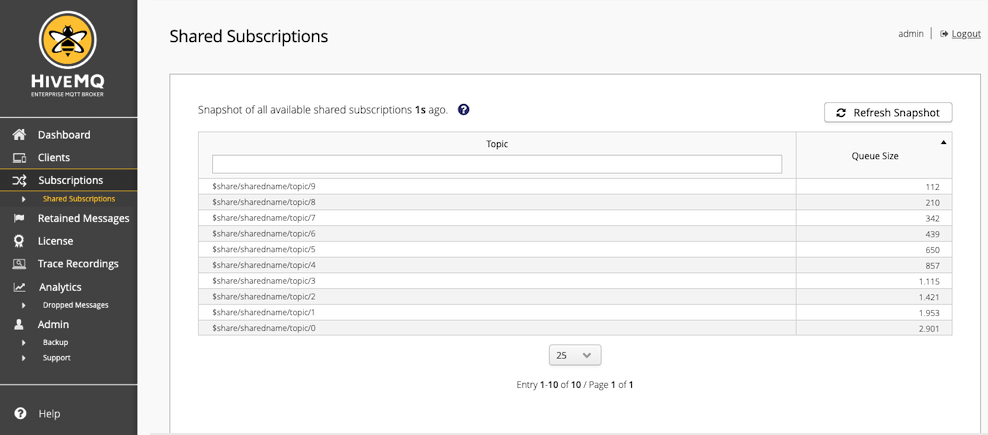
Shared Subscription Overview
The Shared Subscriptions overview provides basic information for each shared subscription on your HiveMQ cluster.
HiveMQ uses cluster-wide snapshots to display all available shared subscriptions. To view information for the shared subscriptions that are currently available, you need to create a fresh snapshot. The HiveMQ snapshot offers a consolidated view of all nodes in your cluster at a particular point in time. This unified snapshot provides an efficient way to sort, filter, and navigate through all of the available MQTT sessions.
To create a snapshot, select Refresh Snapshot. Based on the number of shared subscriptions on your cluster, the refresh process can take a few moments. When the process finishes, an overview table of your current shared subscriptions displays.
To change the order in which the data is sorted on the overview, click the column header. To filter for a specific shared subscription, enter the desired topic in the Topic field.
The sorting options and filters that you apply to the overview table are stored until you log out. If you leave the overview and return later, the filters and sorting options that you applied remain active.
| Snapshots do not update automatically. To manually refresh the data that is shown in the Shared Subscriptions overview, select Refresh Snapshot. |
| Column | Description |
|---|---|
Topic |
The complete topic of the shared subscription including the shared name. |
Queue Size |
The current number of messages that are queued for the shared subscription. |
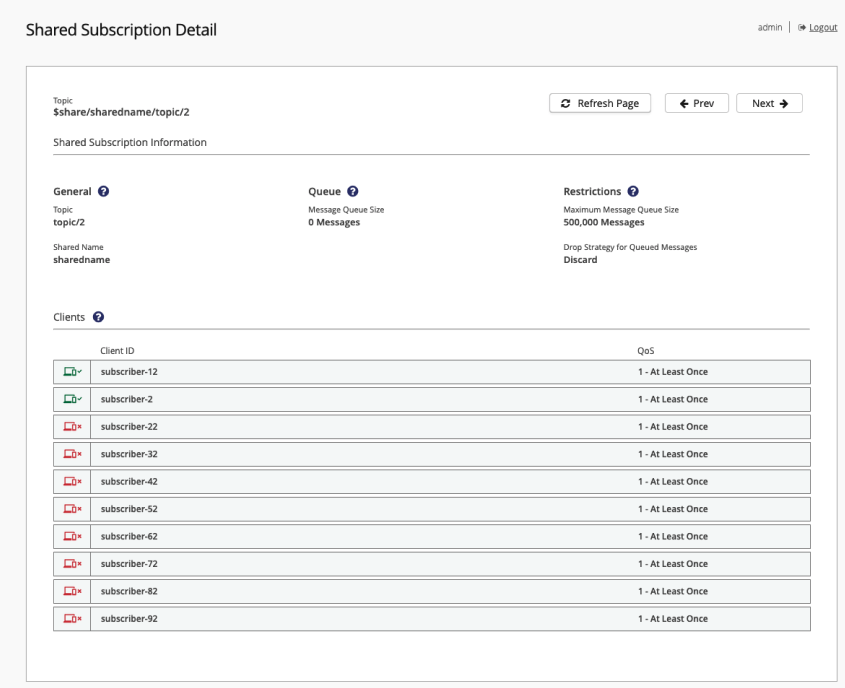
Shared Subscriptions Details
This page displays when you select a topic in the Shared Subscriptions overview.
The shared subscription topic for which details are shown appears at the top of the page.
To view more information about an item on the details page, click the question mark next to the desired column.
For example, more information about shared subscription client details:
The Prev and Next options on your detail pages allow you to easily navigate through entries and respect the filters and sorting options that you apply to the overview table.
Prev: Displays information for the subscription one row before the currently selected entry in the overview table.
Next: Displays information for the subscription one row after the currently selected entry in the overview table.
When you change the sorting order or filters of your Shared Subscription overview, your changes are immediately reflected in the Prev and Next information of your detailed view.
| Column | Description | ||
|---|---|---|---|
General |
Provides basic information on the selected shared subscription:
|
||
Queue |
The number of messages that are currently in the queue of the shared subscription. |
||
Restrictions |
Shows the limits that apply to the shared subscription:
|
||
Clients |
Lists information for each client that shares the subscription. The Clients area can display a maximum of 100 entries:
|
Extension Consumers
The Consumer Service of the HiveMQ Enterprise Extension SDK allows you to register and unregister message consumers. Message consumers can be used to react quickly to incoming publishes on a specific set of topics and further process the consumed messages to meet your business needs. For example, the HiveMQ Enterprise Extension for Kafka uses the Consumer Service to transform MQTT publish messages into Kafka records and then write the records into a Kafka system. For more information, see Consumer Service.
The Extension Consumers overview gives you all the information you need to analyze and adjust the behavior of the extension consumers in your HiveMQ cluster.
HiveMQ uses cluster-wide snapshots to display all available extension consumers. To access up-to-date information on the extension consumers that are currently active, you need to create a fresh snapshot. The HiveMQ snapshot offers a consolidated view of all nodes in your cluster at a particular point in time. This unified snapshot provides an efficient way to sort, filter, and navigate through all available MQTT sessions.
To create a snapshot, select Refresh Snapshot. Depending on the number of extension consumers in your cluster, the refresh process can take a few moments to complete. When the process finishes, an overview table of your current extension consumers displays.
| Snapshots do not update automatically. To manually refresh the data that is shown in the Extension Consumers overview, select Refresh Snapshot. |
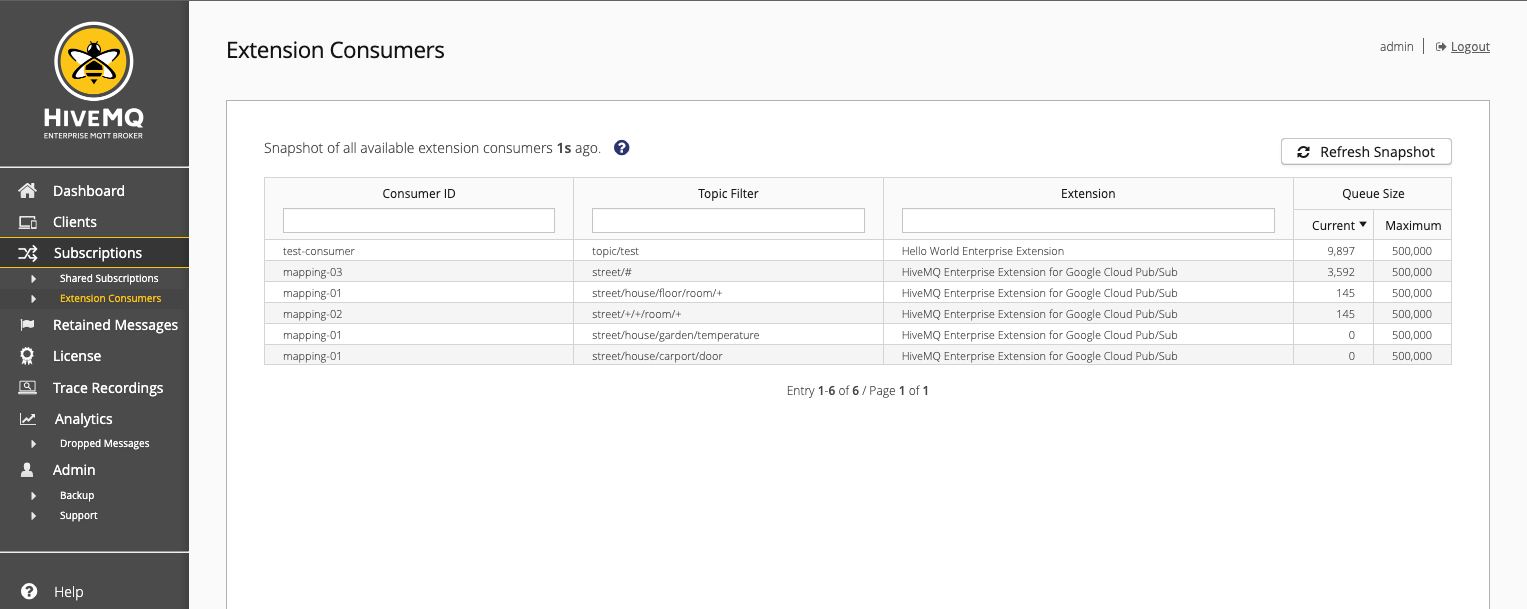
| Column | Description |
|---|---|
Consumer ID |
The unique ID of the consumer. |
Topic Filter |
The topic filter from which the selected extension consumer consumes messages. |
Extension |
The name of the extension for which the selected consumer is registered. |
Queue Size |
The current and maximum number of messages in the message queue of the extension consumer.
|
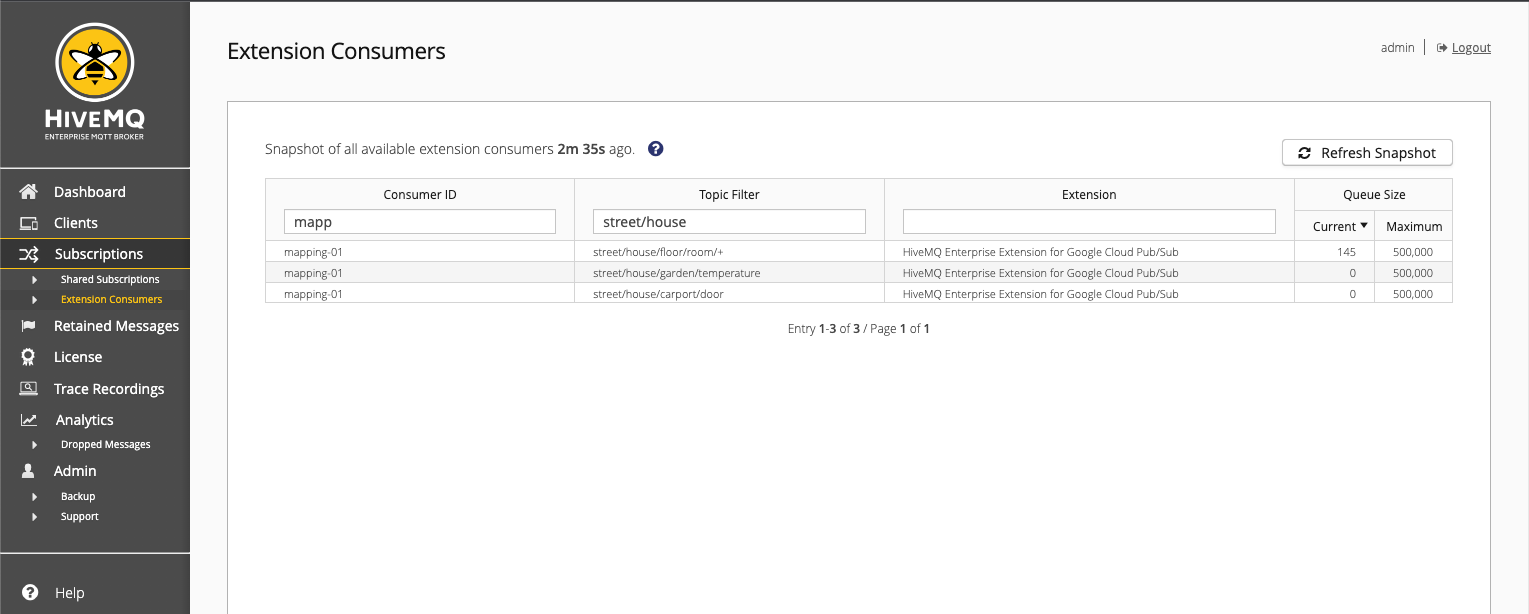
To change the order in which the data is sorted on the overview, click the column header. To filter for a specific extension consumer, enter your search criteria in the input field at the top of the column.
The sorting options and filters you apply to the overview table are stored until you log out. If you leave the overview and return later, the filters and sorting options you applied remain active.
Retained Messages
Keeping track of the millions of retained messages that your HiveMQ cluster processes can be a challenge. The HiveMQ Control Center provides the tools you need to manage all the retained messages in your HiveMQ cluster.
Retained Messages Overview
HiveMQ uses cluster-wide snapshots to display all available retained messages. To view information for the retained messages that are currently available, you need to create a fresh snapshot. The HiveMQ snapshot gives you a consolidated view of all nodes in your cluster at a particular point in time. This unified snapshot provides an efficient way to sort, filter, and navigate through all retained messages that are available on your cluster.
To create a snapshot, select Refresh Snapshot. Based on the number of retained messages that are available in your cluster, the refresh process can take a few moments. When the process finishes, an overview table of the retained messages displays.
To change the order in which the data is sorted on the overview, click the column header. To filter the messages that are displayed by topic, enter the desired topic in the input field of the Topic column.
The sorting options and filters that you apply to the retained messages overview table are stored until you log out. If you leave the retained messages overview and return later, the filters and sorting options that you applied to the overview table remain active.
| Snapshots do not update automatically. To manually refresh the data that is shown in the retained messages overview, select Refresh Snapshot. |
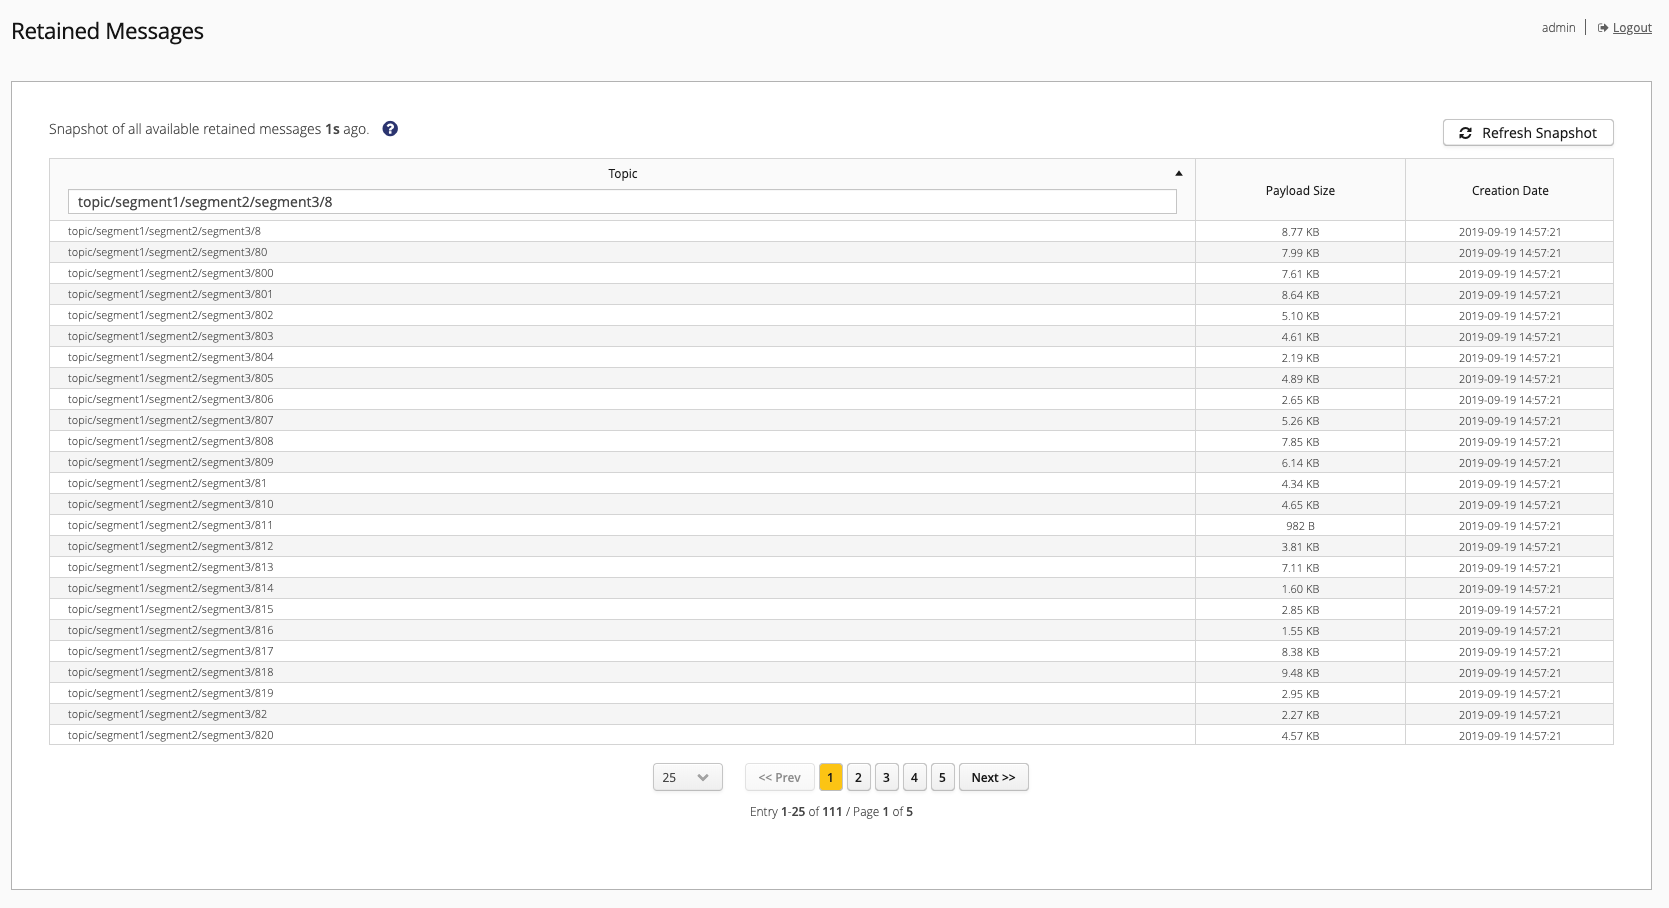
| Column | Description |
|---|---|
Topic |
The topic of the retained message. |
Payload Size |
The size of the payload of the retained message. |
Creation Date |
The date and time when the retained message was created. |
Retained Message Details
This page displays when you select the topic of a retained message in the Retained Messages overview. The topic of the retained message for which details are shown appears at the top of the page.
Prev and Next options on each detail page allow you to easily navigate through the retained messages that are listed on your retained messages overview table.
Prev displays detailed information for the message one row before the currently selected entry in the overview table.
Next displays detailed information for the message one row after the currently selected entry in the overview table.
If you change the sorting order or filters on the Retained Messages overview table, the changes are immediately reflected in the Prev and Next information.
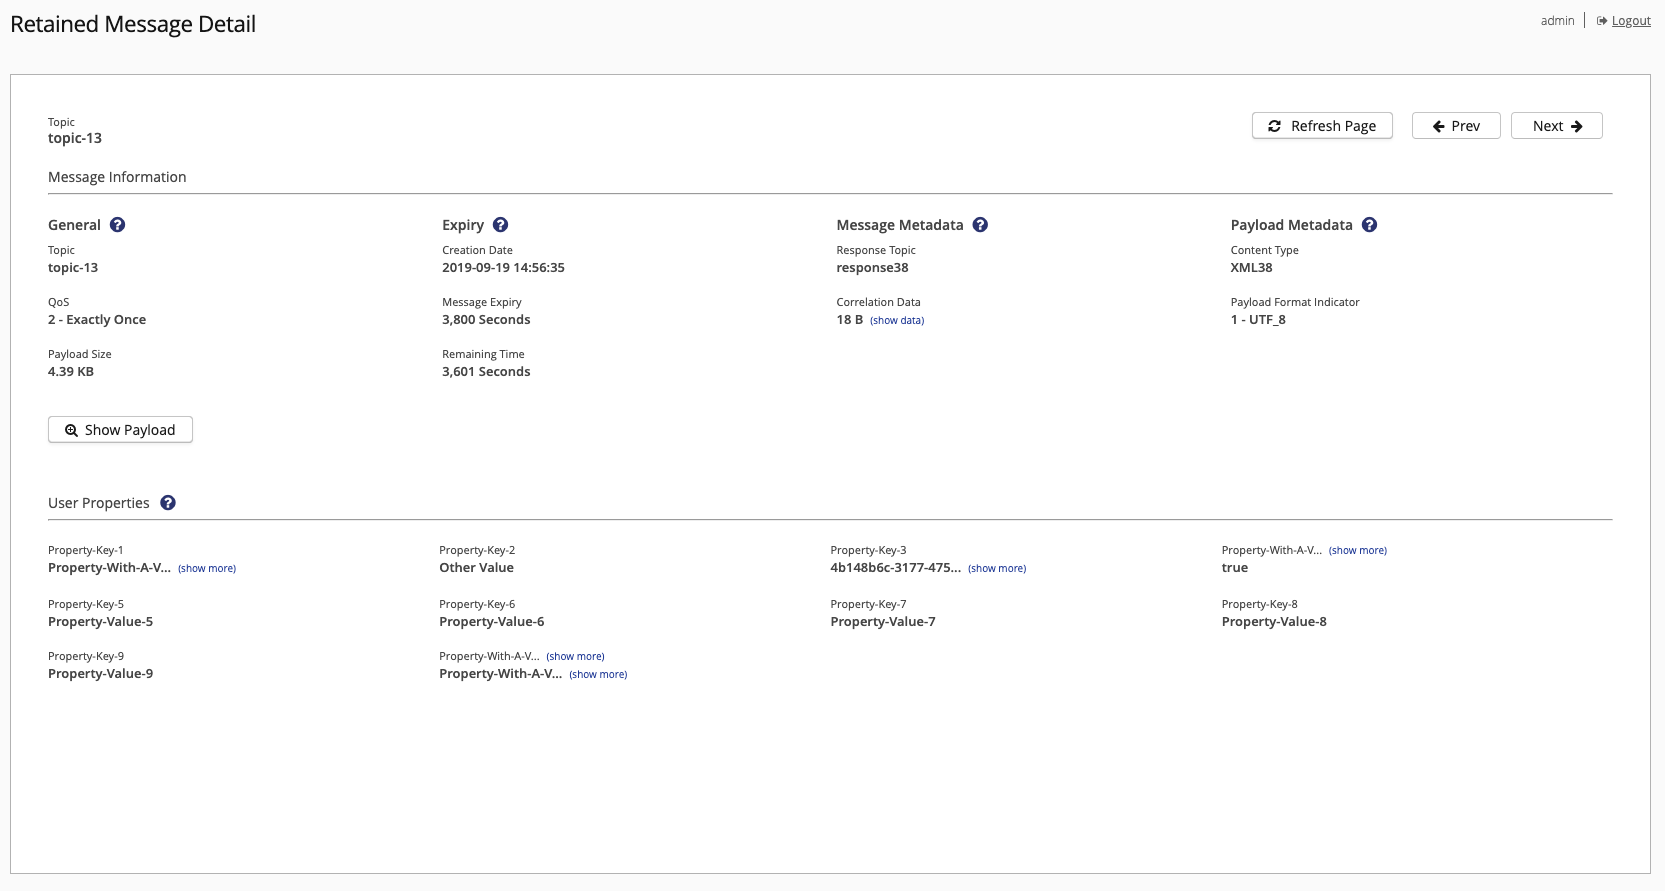
The Retained Message Detail page provides message information and user property information for the retained message that is currently selected.
To view more information for items shown on the details page, select the question mark next to the desired column.
General
Shows basic information about the retained message that is currently selected.
| Item | Description |
|---|---|
Topic |
The topic of the retained message. |
QoS |
The Quality of Service (QoS) level of the retained message. There are three QoS levels:
|
Payload Size |
The amount of data that the payload of the retained message contains in bytes. NOTE: The payload size does not reflect other data such as user properties or correlation data that the retained message can transmit. |
Expiry
Shows when the retained message was created and how long the message is valid.
| Item | Description |
|---|---|
Creation Date |
The date and time the retained message was published. |
Message Expiry |
The message-expiry interval that is set for the retained message. The expiry timer starts at the moment that the retained message is published. |
Remaining Time |
The time in seconds until the message expires and is deleted from HiveMQ. The time is calculated in seconds at the moment the detail page loads. To recalculate the time until the message expiration, select Refresh Snapshot. |
Message Metadata
Shows information that is used in a request/response pattern for the retained message. This information is only available for MQTT 5.
| Item | Description |
|---|---|
Response Topic (optional) |
The identifier used to implement a request/response pattern between clients. |
Correlation Data (optional) |
The data used to match response requests to the correct response messages. |
Payload Metadata
Shows information about the type and format of the data in the payload of the retained message. This information is only available in MQTT 5.
| Item | Description |
|---|---|
Content Type (optional) |
The UTF-8 encoded strings that describe the content of the retained message payload. For example, text/plain. |
Payload Format Indicator (optional) |
A value that shows whether the message payload contains UTF-8 encoded character data or unspecified bytes. |
| To view more information on the payload of the retained message, select Show Payload. |
User Properties
The User Properties area of the details page shows the name and value of all user properties for the retained message.
User properties are defined as part of the sender implementation.
The meaning of the user properties is not defined by MQTT.
User properties are only available for MQTT 5.
| The User Properties area shows a maximum of 500 properties. |
Data Hub in the HiveMQ Control Center
In modern business initiatives, data provides the foundation for making informed and strategic decisions. Data-driven insights can lead to improved products and services, better customer experiences, and more efficient operations. HiveMQ Data Hub gives you the ability to ensure that the data you accept from your data sources has the quality you expect. Data Hub also makes it possible to model how your MQTT clients work with your broker. You can manage Data Hub from the HiveMQ Control Center or with the HiveMQ REST API.
HiveMQ Control Center support for Data Hub simplifies usage for users who prefer graphical user interfaces over command line tools. Our policy creation wizards provide an intuitive way to create new policies with context help and immediate feedback on policy validity. Our well-organized overviews help you efficiently manage your schemas and policies:
Data Hub Views in the HiveMQ Control Center
-
Dashboard Get a clear snapshot of the current data quality in your data pipelines.
-
Schemas Overview Create, list, edit, and delete your Data Hub schemas.
-
Scripts Overview Create, list, edit, and delete your Data Hub scripts.
-
Data Policies Overview Create, list, edit, and delete data policies.
-
Behavior Policies Overview Create, list, edit, and delete behavior policies.
Dashboard
The Data Hub dashboard provides a clear overview of the current quality of your data pipelines.
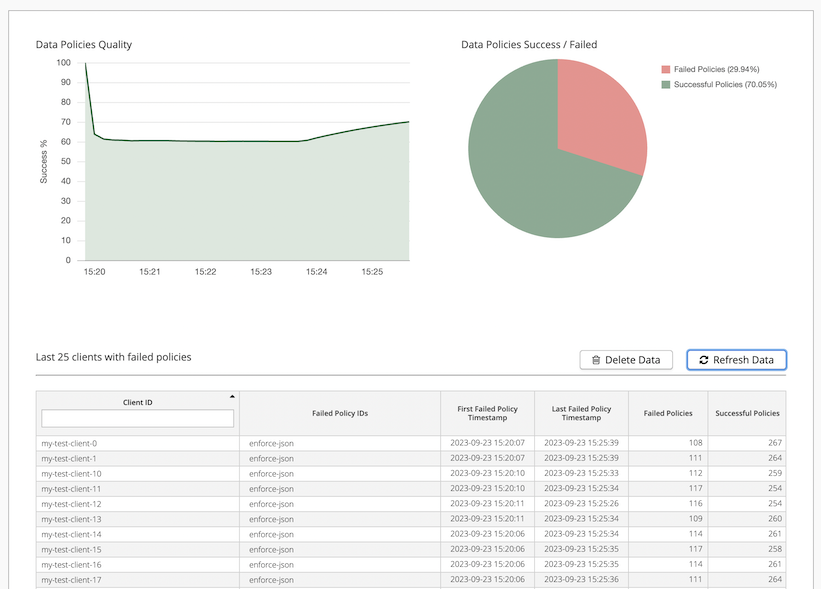
The visualizations and client list on the dashboard can help you quickly understand the state of your data pipelines and act to resolve issues with problematic clients efficiently:
-
Data Quality Policies: The recent aggregated quality of all data policies on your HiveMQ deployment as indicated by the percentage of successful policies cluster-wide.
-
Data Policies Success / Failed: The current cluster-wide percentages of failed policies and successful policies.
-
Clients with failed policies: A snapshot of all clients that have failed policies with basic information to identify the client and links to the associated policy details.
| Column | Description |
|---|---|
Client ID |
Displays the client ID of the client that failed the policy. |
Failed Policy IDs |
Lists all policies that the client failed. To view the details of a policy, select the policy ID. If the policy has been deleted, the ID is not clickable. |
First Failed Policy Timestamp |
Displays the timestamp when the client sent the first payload that violated a policy. |
Last Failed Policy Timestamp |
Displays the timestamp when the client sent the latest payload that violated a policy. |
Failed Policies |
Displays the aggregated number of all failed policies for the client. |
Successful Policies |
Displays the aggregated number of all successful policies for the client. |
| The charts on the dashboard automatically update every 10 seconds. To manually refresh the data shown in the list of failed clients, select Refresh Data. By default, the client list is sorted with the most recent entries at the top. To clear the data that is shown in the list, select Delete Data. |
For detailed information on Data Hub features and configuration options, see HiveMQ Data Hub.
Schemas Overview
Schemas are an essential part of data policies.
Your Data Hub schemas define the rules and constraints that MQTT payload data must adhere to.
These constraints help to ensure data quality and to maintain the integrity of your HiveMQ deployment.
Data Hub currently supports JSON Schemas and Protobuf.
For more information on the use of schemas in HiveMQ Data Hub, see Schemas.
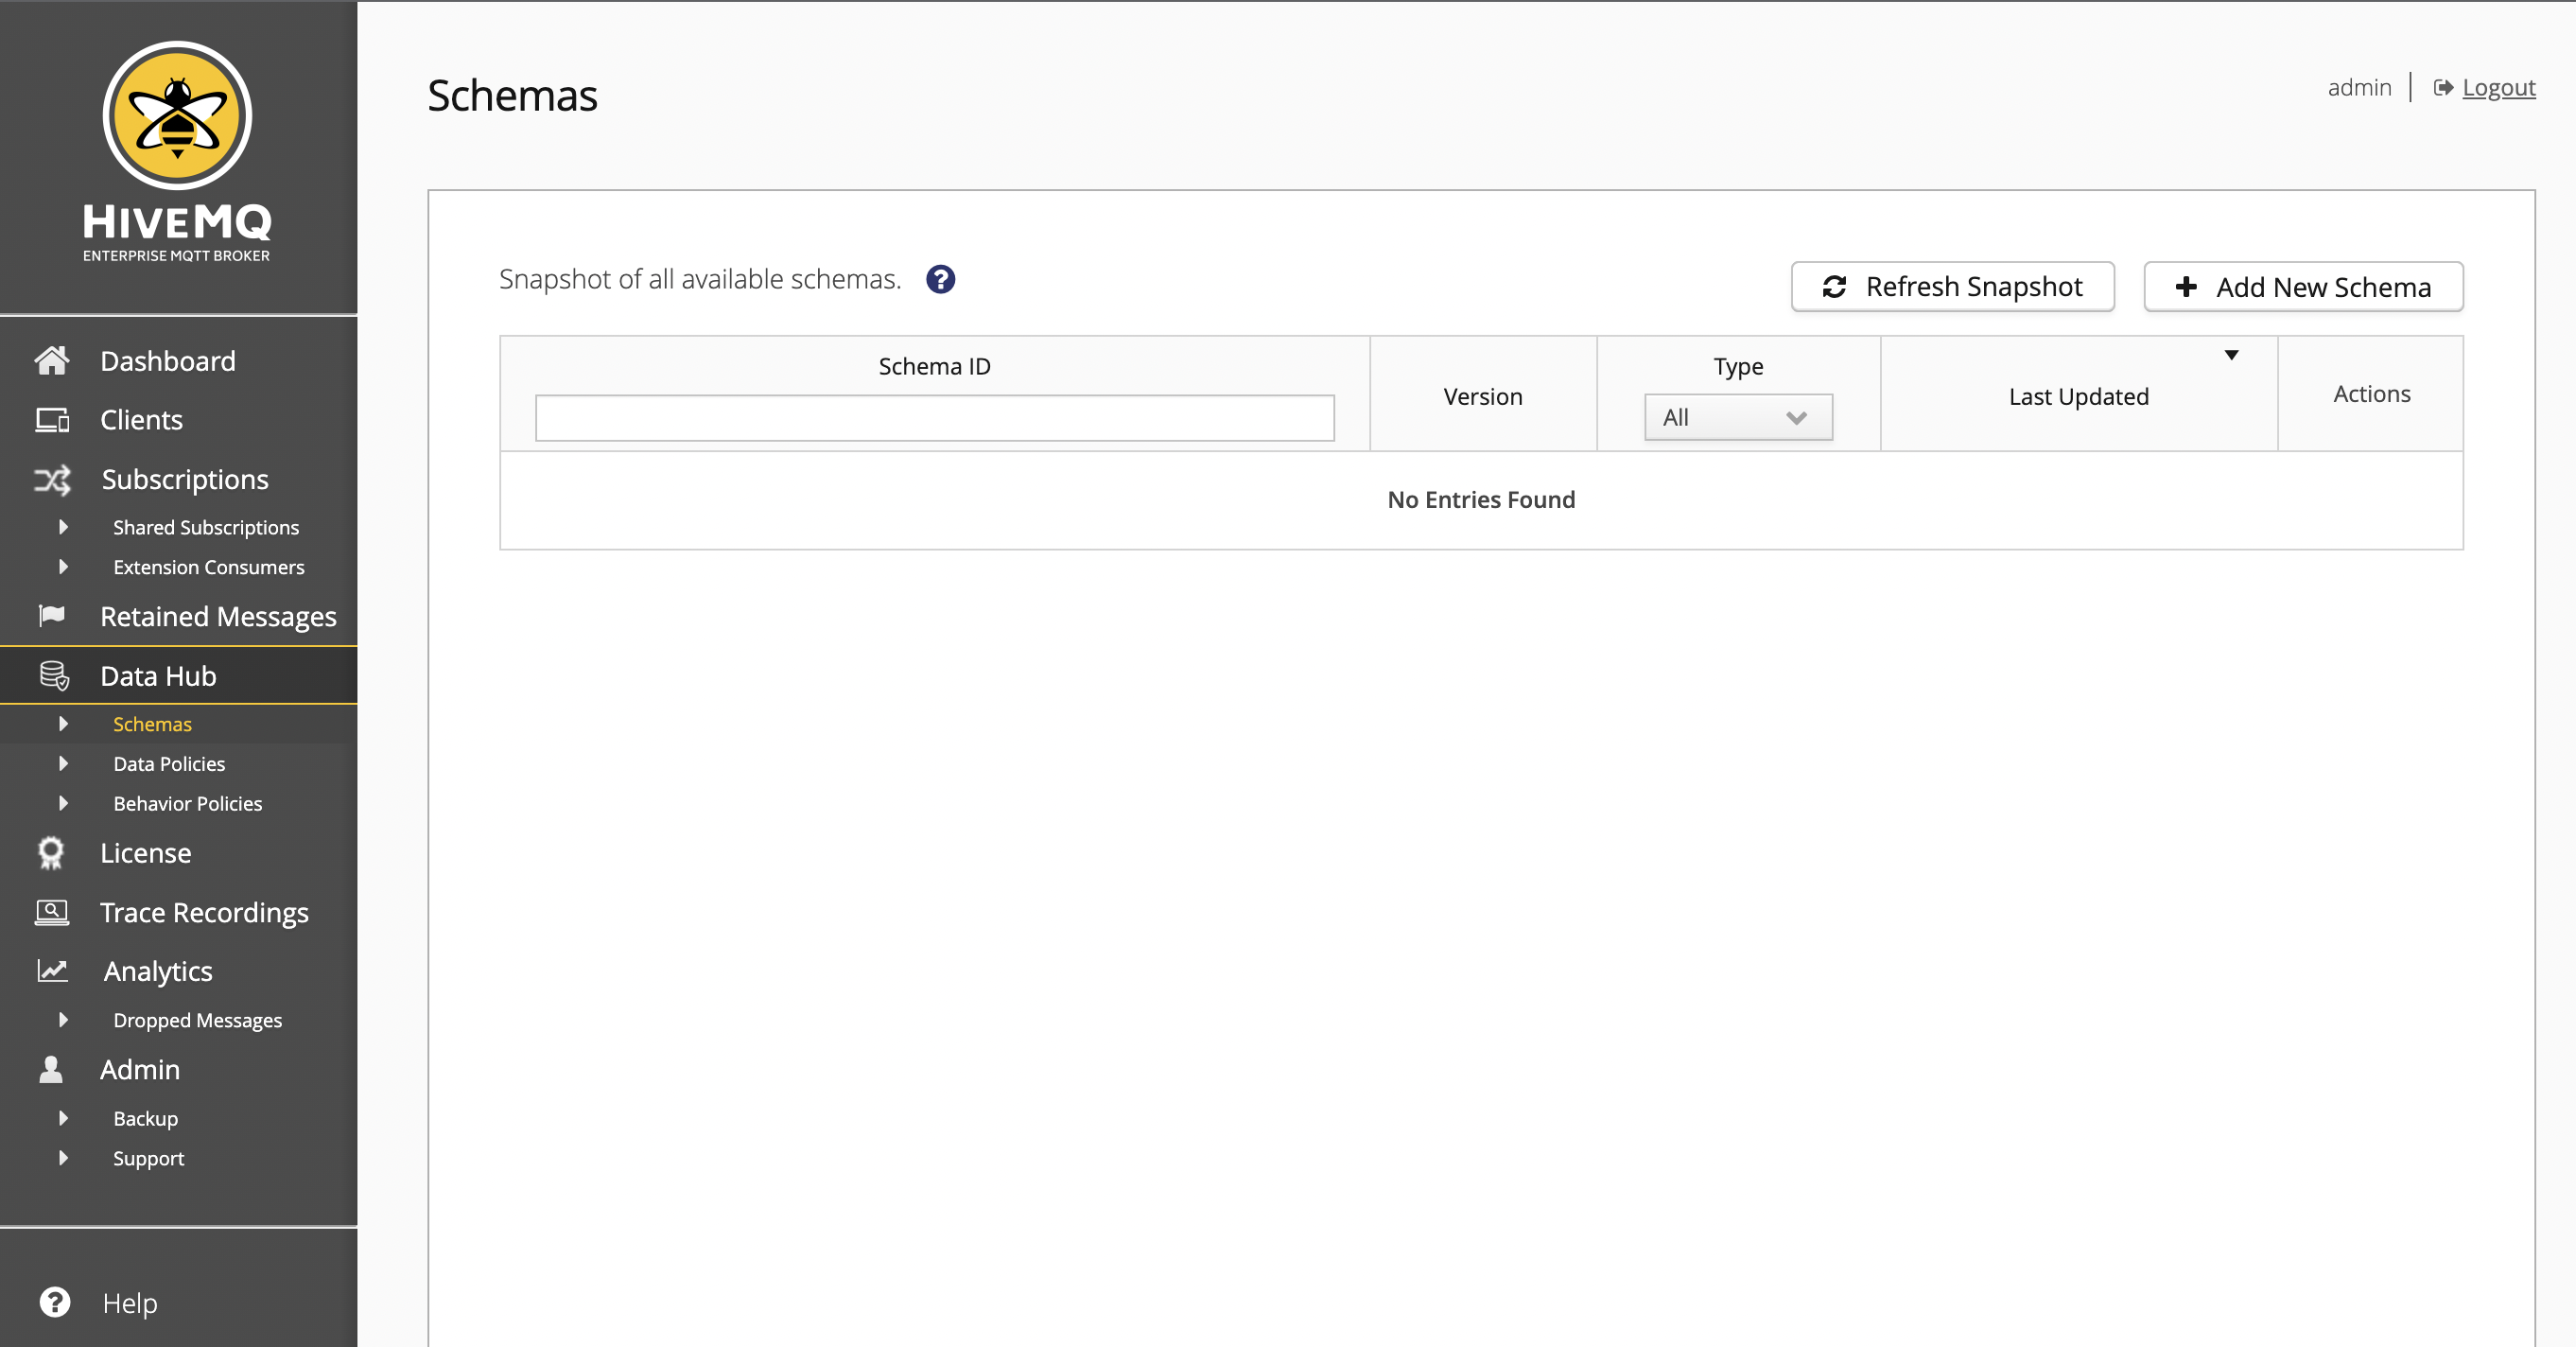
The Schemas overview provides basic information for each schema on your HiveMQ cluster.
HiveMQ uses cluster-wide snapshots to display all available schemas. To view information for the schemas that are currently available, you need to create a fresh snapshot. The HiveMQ snapshot offers a consolidated view of all nodes in your cluster at a particular point in time. This unified snapshot provides an efficient way to sort, filter, and navigate through all available schemas.
To take a new snapshot, select Refresh Snapshot.
When you filter or sort the information on the overview, the snapshot automatically updates.
|
Since Data Hub supports schema versioning, each schema can have multiple versions. To enhance readability, the Schemas overview displays only the latest version of the schema. |
| Column | Description |
|---|---|
Schema ID |
Shows the schema identifier. To view the schema details, select the desired schema in the table. |
Version |
The latest version number of the schema. |
Type |
Filters for JSON Schema or Protobuf. |
Last Updated |
The time when the schema has been updated latest |
Action |
Depending on your permissions, icons are shown to view, edit, or download the data policy. |
To create a new schema, select Add New Schema. For more information see, Schema Detail - Create Schema.
To view and manage an existing schema, select the name of the schema in the Schemas overview. For more information, see Schema Detail -View Schema Details
Schema Detail - Create Schema
The Schema Detail - Create Schema page displays when you select the Add New Schema option on the Schemas overview. Here, you can create and save new schemas:
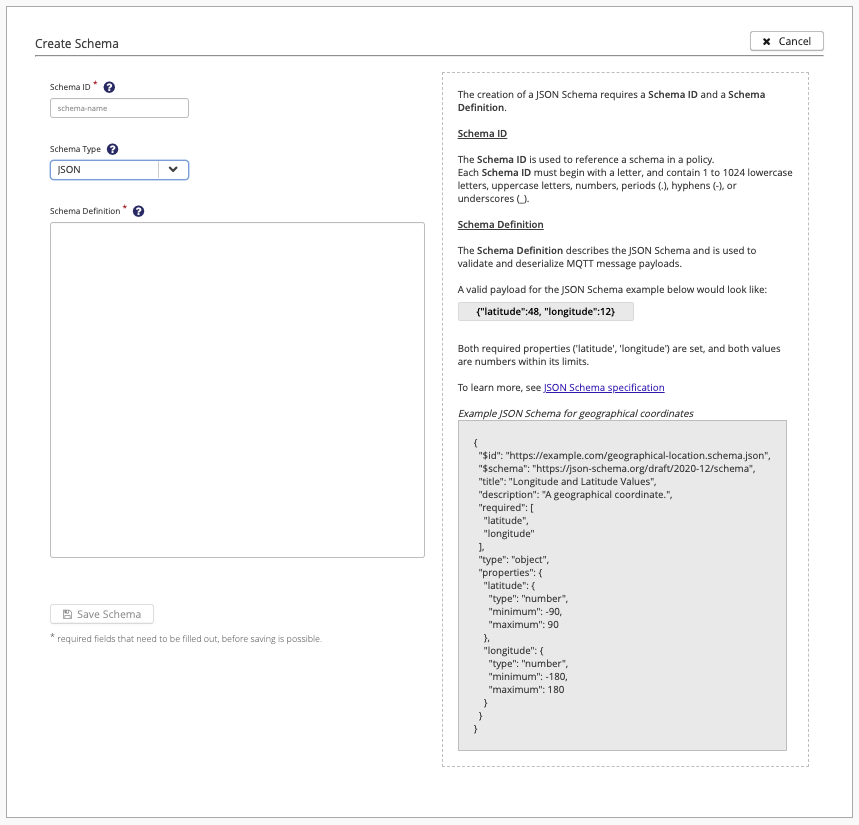
All Data Hub detail pages include extensive context-sensitive help.
To open additional information for a particular item, click the ? icon.
|
The options and help text automatically adjust based on your configuration choices. For example, the creation of a JSON Schema requires a Schema ID and a Schema Definition and the creation of a Protobuf schema requires a Schema ID, Schema Definition, and a Message Type.
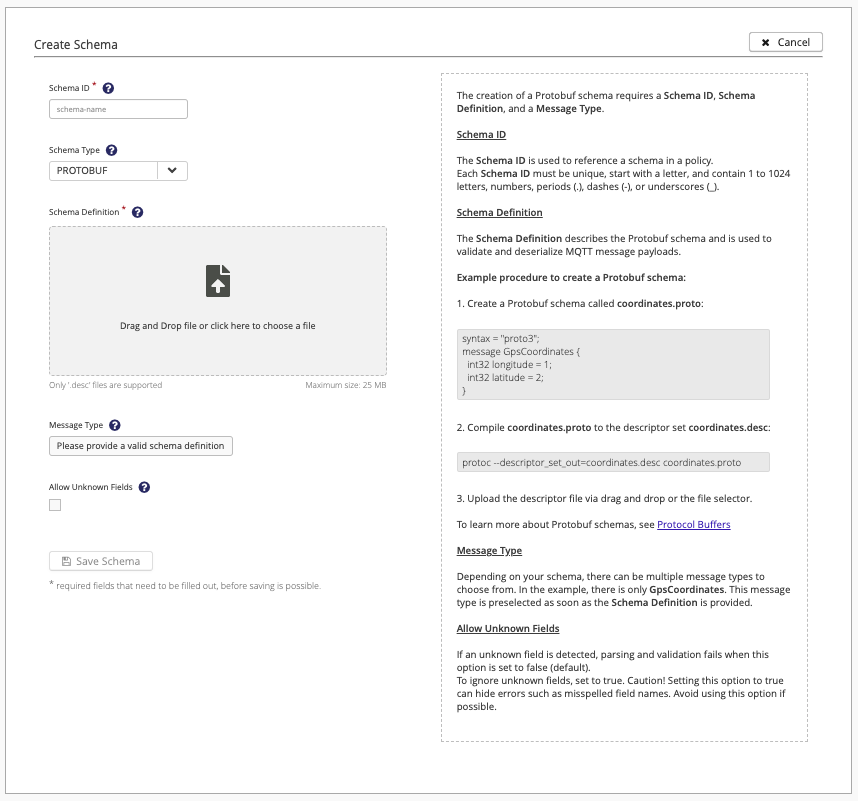
For detailed information on the configuration and use of schemas in Data Hub, see Data Hub Schemas.
Schema Detail -View Schema Details
The Schema Detail - for Schema ID page displays when you select an existing schema on the Schemas overview. Here, you can add new schema versions, download schema versions, or delete all versions of the selected schema:
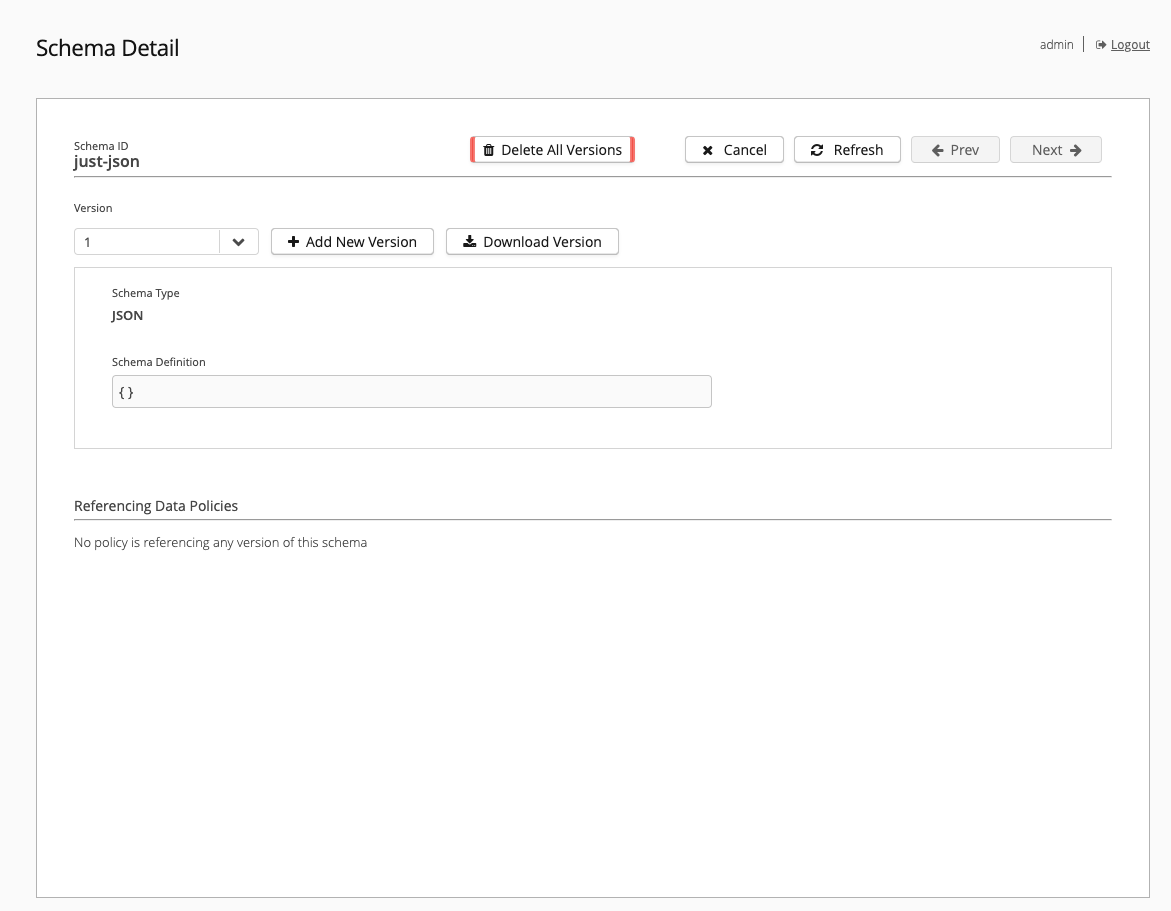
| It is only possible to delete schemas and schema versions that are not referenced in a policy. If an existing policy references the schema, you must delete the policy before you delete the schema. |
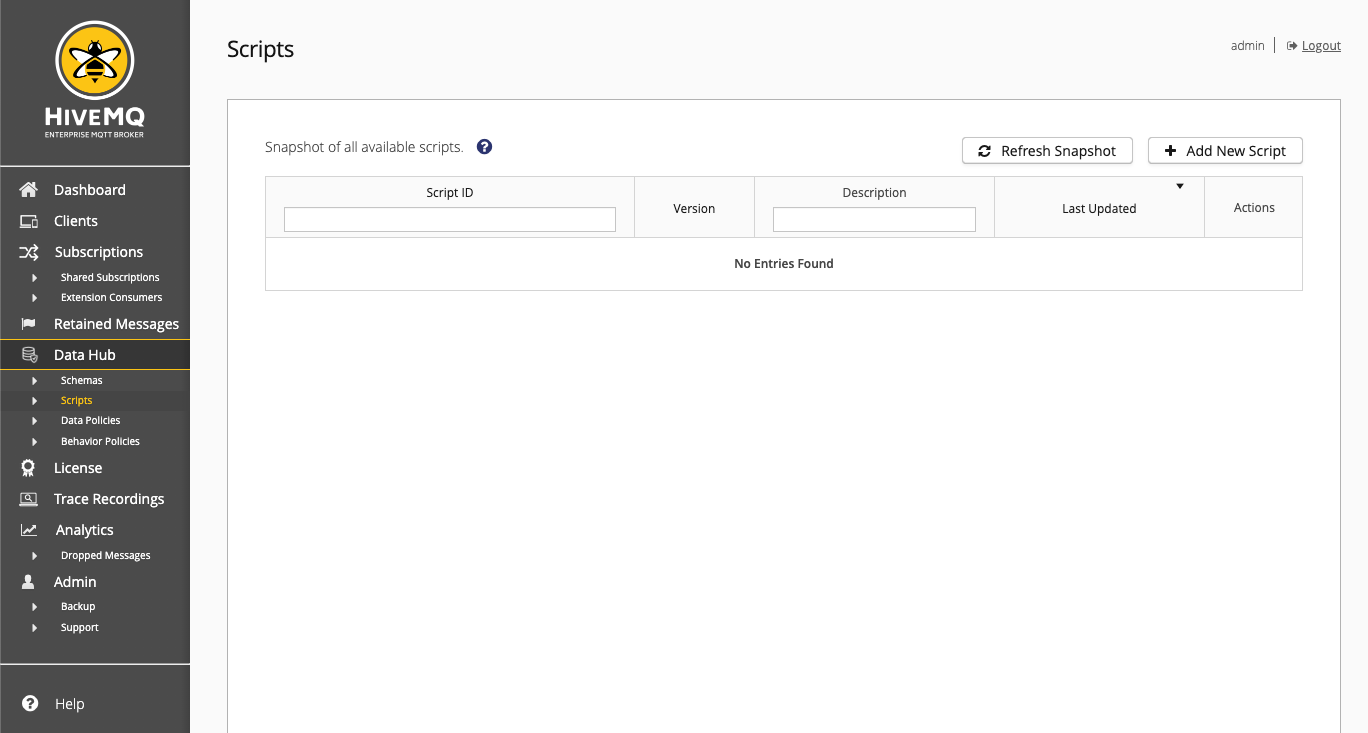
Scripts Overview
IoT devices can send a wide range of data sets. As a result, the MQTT data you receive often contains diverse data points, formats, and units. Data transformation scripting with JavaScript can help you bring diverse data into a common format that an application can understand and process.
The Data Hub transformations feature gives you the ability to add custom JavaScript-based transformation functions to Data Hub data policies. For more information on the use of JavaScript scripting in Data Hub see, HiveMQ Data Hub Transformations.
HiveMQ uses cluster-wide snapshots to display all available scripts. To view information for the scripts that are currently available, create a fresh snapshot. The HiveMQ snapshot offers a consolidated view of all scripts in your cluster at a particular point in time. This unified snapshot provides an efficient way to sort, filter, and navigate through all available scripts.
To take a new snapshot, select Refresh Snapshot.
When you filter or sort the information on the overview, the snapshot automatically updates.
| Column | Description |
|---|---|
Script ID |
Shows the script identifier. To view the script details, select the desired script in the table. |
Version |
The latest version number of the script. |
Description |
Information about the purpose of the script. |
Last Updated |
The time when the script was most recently updated. |
Action |
Depending on your permissions, icons are shown to view, edit, or download the script. |
To create a new script, select Add New Script. For more information see, Script Detail - Create Script.
To view and manage an existing schema, select the name of the schema in the Script overview. For more information, see Script Detail -View Script Details
Script Detail - Create Script
The Script Detail - Create Script page displays when you select the Add New Script option on the Script overview. Here, you can create and save new scripts:
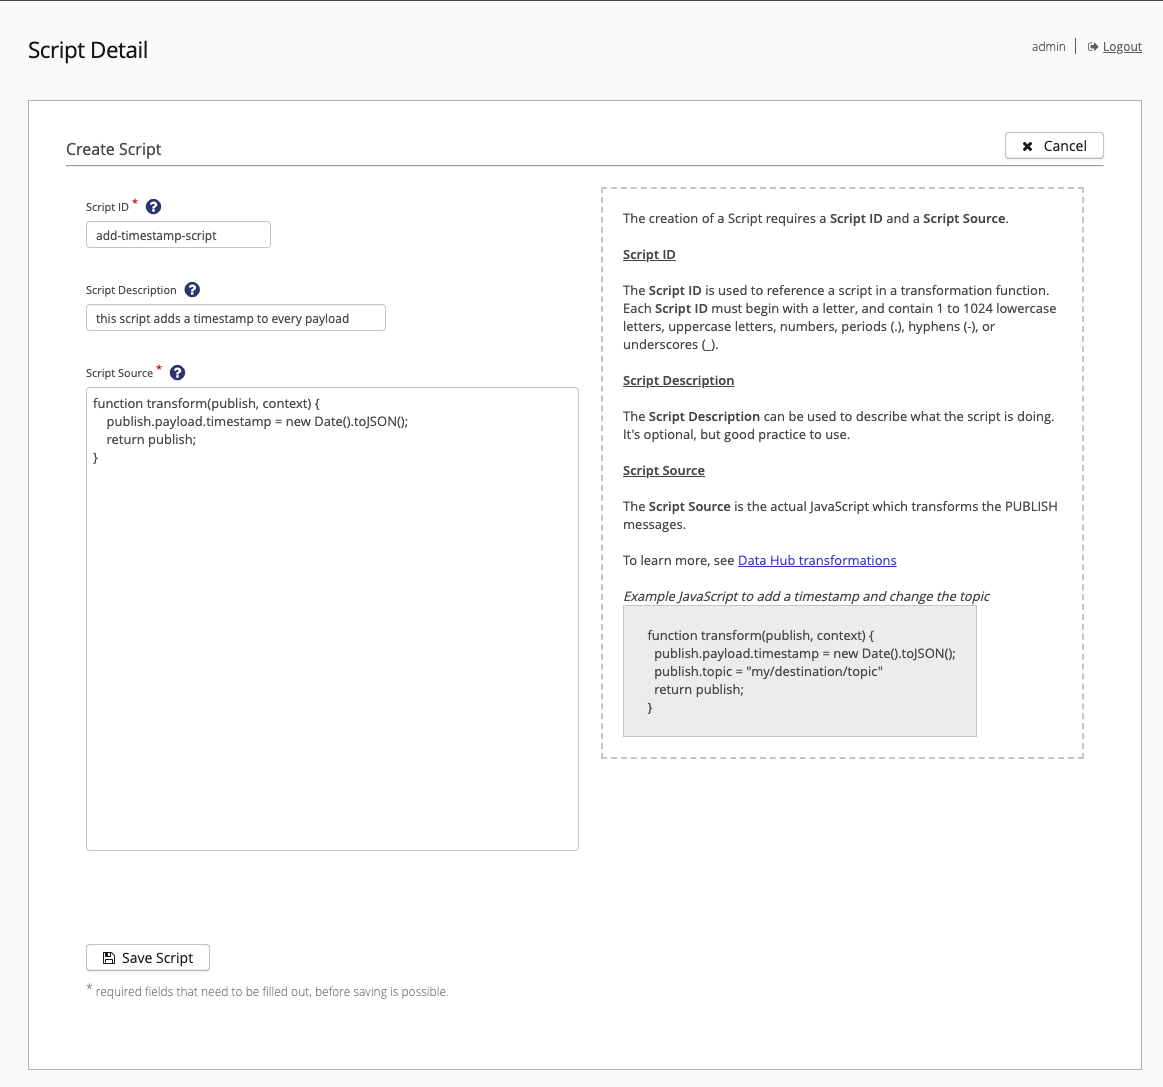
All Data Hub detail pages include extensive context-sensitive help.
To open additional information for a particular item, click the ? icon. Required fields are marked with an asterisk (*).
|
To save your script, select Save Script.
Script Detail -View Script Details
The Script Detail - for Script ID page displays when you select an existing script on the Script overview. Here, you can add new script versions, download script versions, or delete all versions of the selected script:
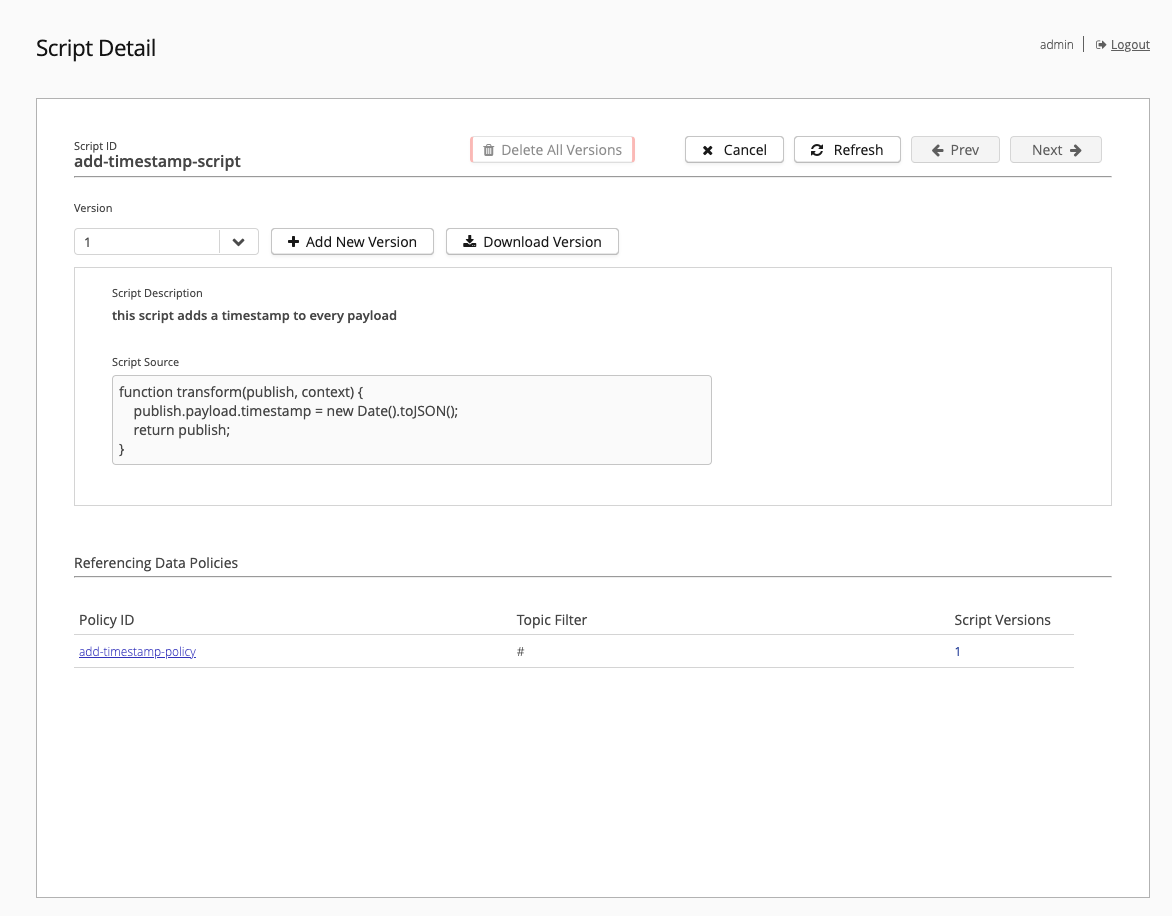
The Referencing Data Polices area of the detail lists and links to all data policies that use the script.
| It is only possible to delete scripts that are not referenced in a policy. To delete the script, you must first delete all policies that reference the script. After you delete the policies listed, wait at least 30 seconds before deleting the script. The delay ensures that all pipelines that currently execute the script can finish. |
Data Policies Overview
You can create and manage two types of policies on the control center: data policies and behavior policies.
Data Hub data policies ensure that the payload data in MQTT messages has the structure and format you expect. Data Policies use schema-based data validation to verify that MQTT data meets your requirements.
The Data Policies overview provides basic information for each data policy on your HiveMQ cluster.
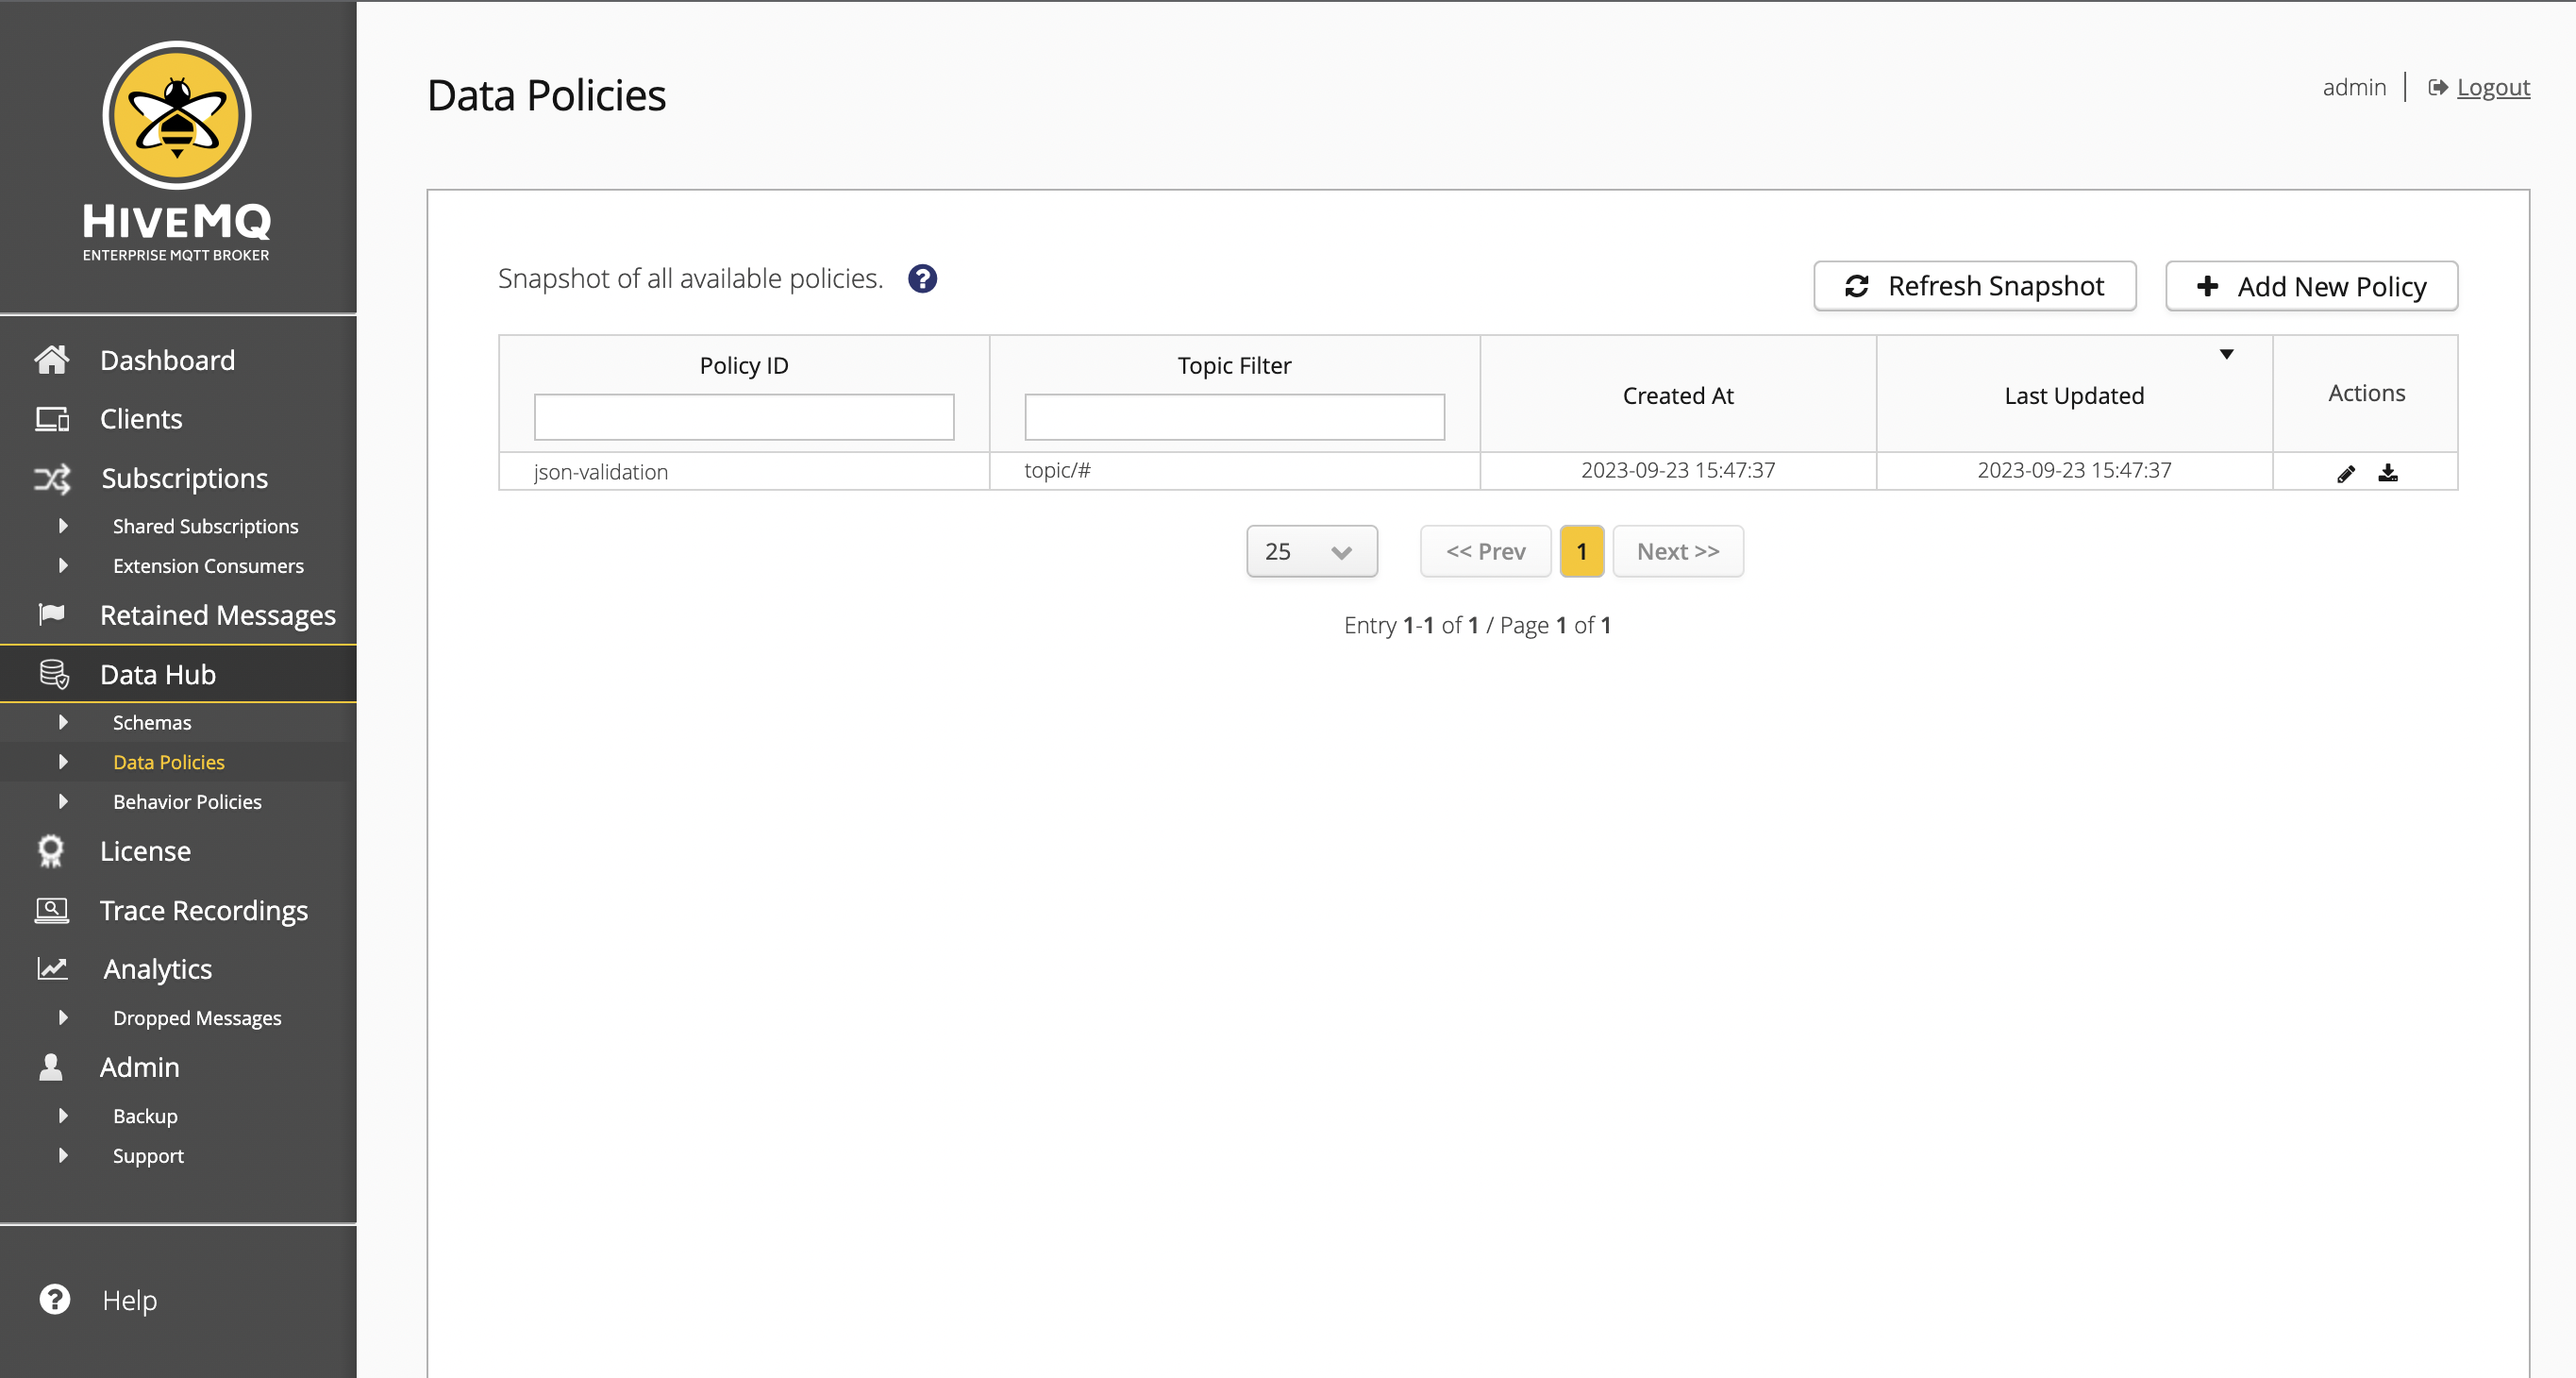
| Column | Description |
|---|---|
Policy ID |
Displays the unique identifier of the policy on the HiveMQ cluster. Select the policy ID, to open a summary of the data policy to access details and editing options. |
Topic Filter |
The defined topic filter of the data policy. |
Created At |
The time when the data policy was initially created. |
Last Updated |
The time when the data policy was last updated. |
Actions |
Depending on your permissions, icons are shown to view, edit, or download the data policy. |
HiveMQ uses cluster-wide snapshots to display all available data policies. To view information for the data policies that are currently available, you need to create a fresh snapshot. The HiveMQ snapshot offers a consolidated view of all nodes in your cluster at a particular point in time. This unified snapshot provides an efficient way to sort, filter, and navigate through all available data policies.
To take a new snapshot, select Refresh Snapshot.
Based on the number of data policies on your cluster, the refresh process can take a few moments.
When you filter or sort the information on the overview, the snapshot automatically updates.
To create a new data policy, select Add New Policy.
Data Policy Detail
The Data Policy Detail page displays when you select the Add New Data Policy option on the Data Policies overview.
The tabs of the Data Policy Detail guide you through the policy creation process from the selection of validators to the configuration of actions the validation outcomes can trigger.
All Data Hub detail pages include extensive context-sensitive help.
To open additional information for a particular item, click the ? icon.
|
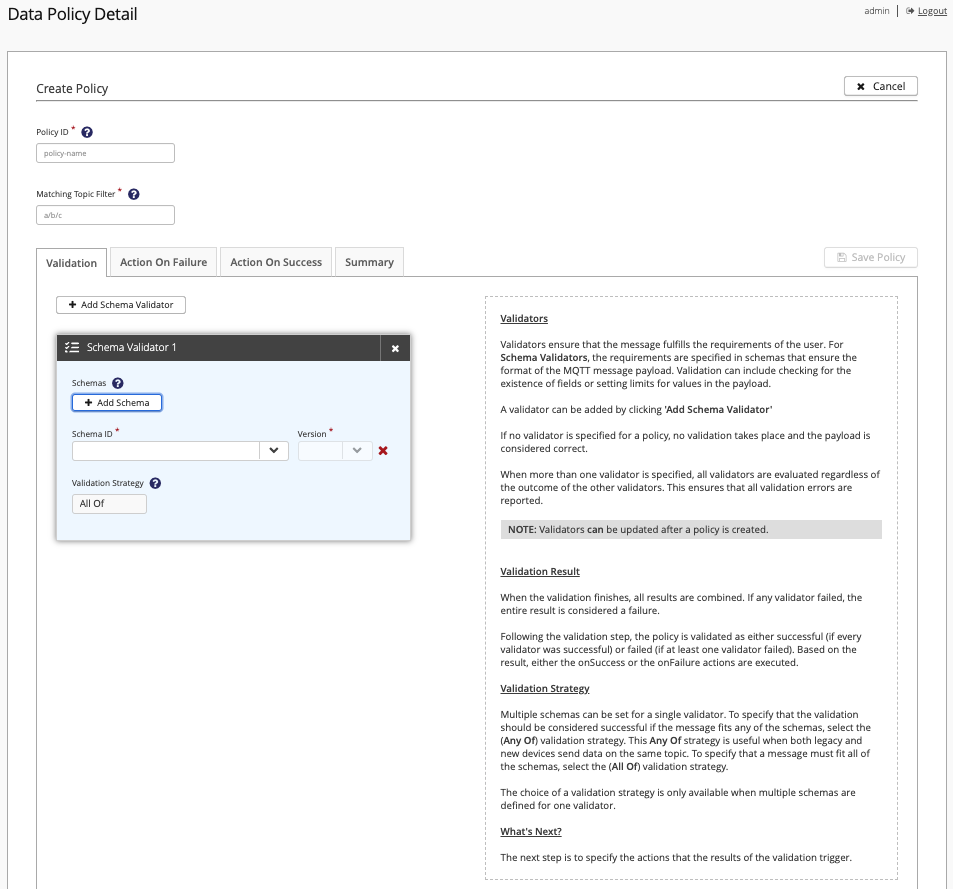
For detailed configuration information and examples, see Data Hub Data Policies
Required fields are marked with an *.
To save the policy, all required fields must be completed.
You can save your policy at any time or switch to the Summary tab to review the policy before you save.
The Summary page of the Data Policy Detail allows you to review, edit, save, or delete your data policy. The summary information includes links to all schemas and scripts that are associated with the selected policy.
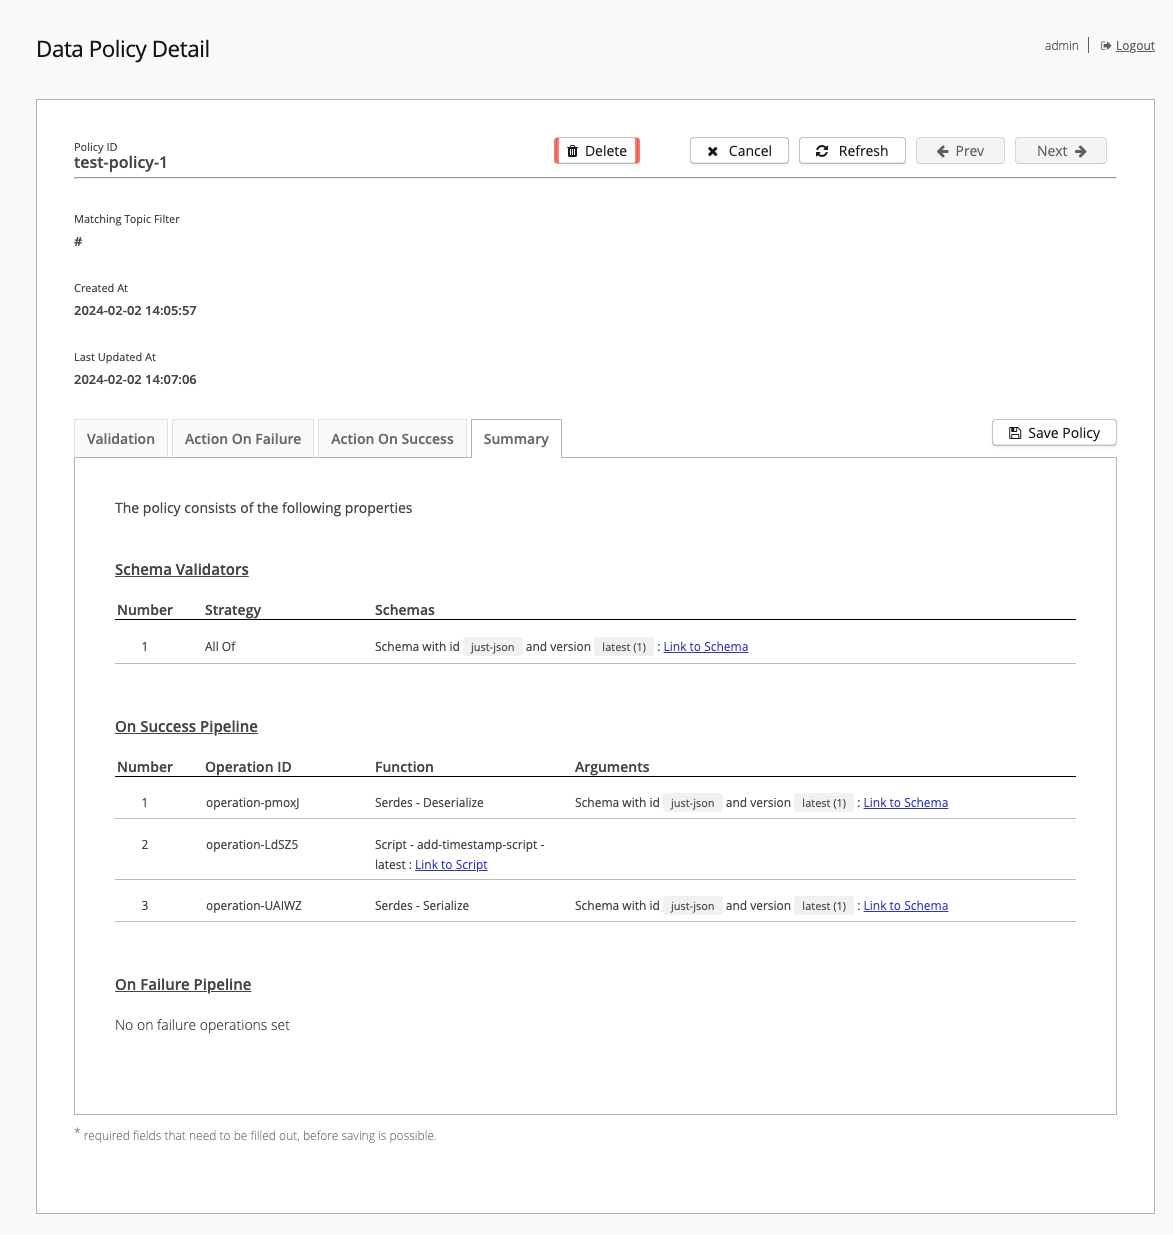
To close the Summary and return to the Data Policies overview, select Cancel.
Behavior Policies Overview
You can create and manage two types of policies on the control center: data policies and behavior policies.
Data Hub behavior policies give you the ability to model the behavior of your MQTT clients throughout the entire lifecycle of the client.
Client behavior is checked against your defined behavior model to determine whether the client is acting in the expected manner.
The behavior model builds a level of control on top of the MQTT protocol with a state machine that checks how the client works with the HiveMQ broker.
For more information on the use of behavior policies in HiveMQ Data Hub, see Behavior Policies.
The Behavior Policies overview provides basic information for each behavior policy on your HiveMQ cluster.
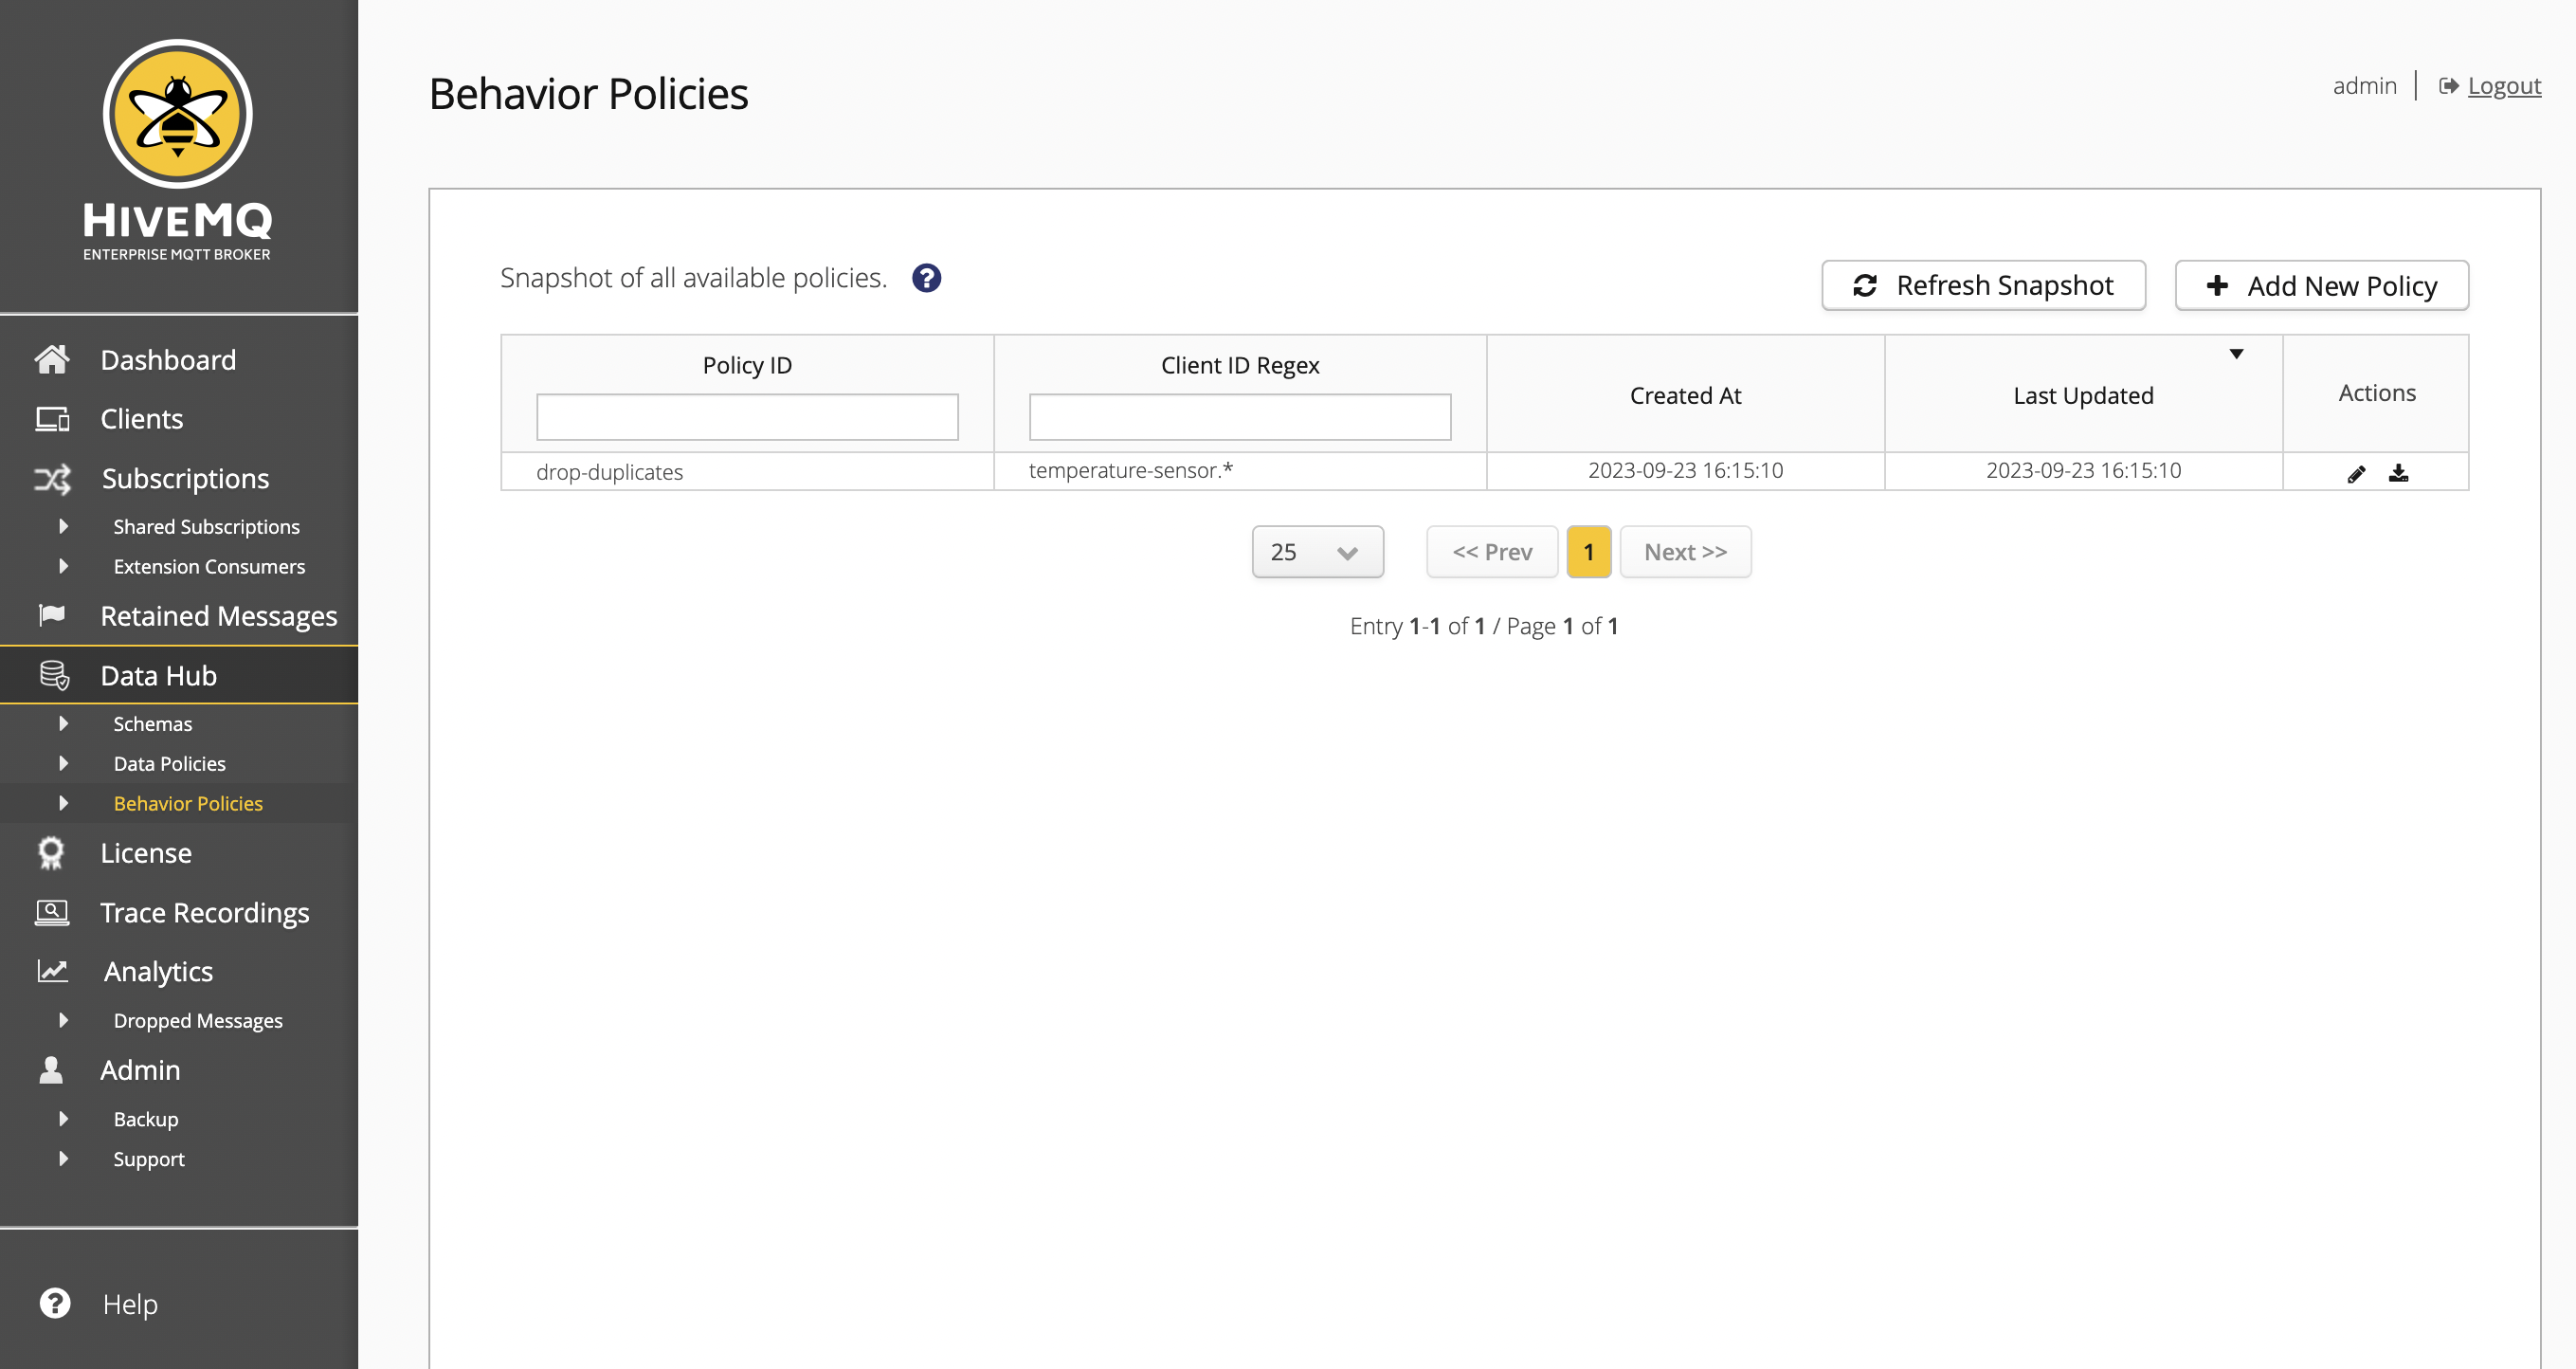
| Column | Description |
|---|---|
Client ID Regex |
Displays regular expression matching the client ID. For more information, see Behavior Policy Matching |
Created At |
The time when the behavior policy was initially created. |
Last Updated |
The time when the behavior policy was last updated. |
Action |
Depending on your permissions, icons are shown to view, edit, or download the data policy. |
HiveMQ uses cluster-wide snapshots to display all available behavior policies. To view information for the behavior policies that are currently available, you need to create a fresh snapshot. The HiveMQ snapshot offers a consolidated view of all nodes in your cluster at a particular point in time. This unified snapshot provides an efficient way to sort, filter, and navigate through all available behavior policies.
To take a new snapshot, select Refresh Snapshot.
When you filter or sort the information on the overview, the snapshot automatically updates.
Based on the number of behavior policies on your cluster, the refresh process can take a few moments.
To create a new behavior policy, select Add New Policy.
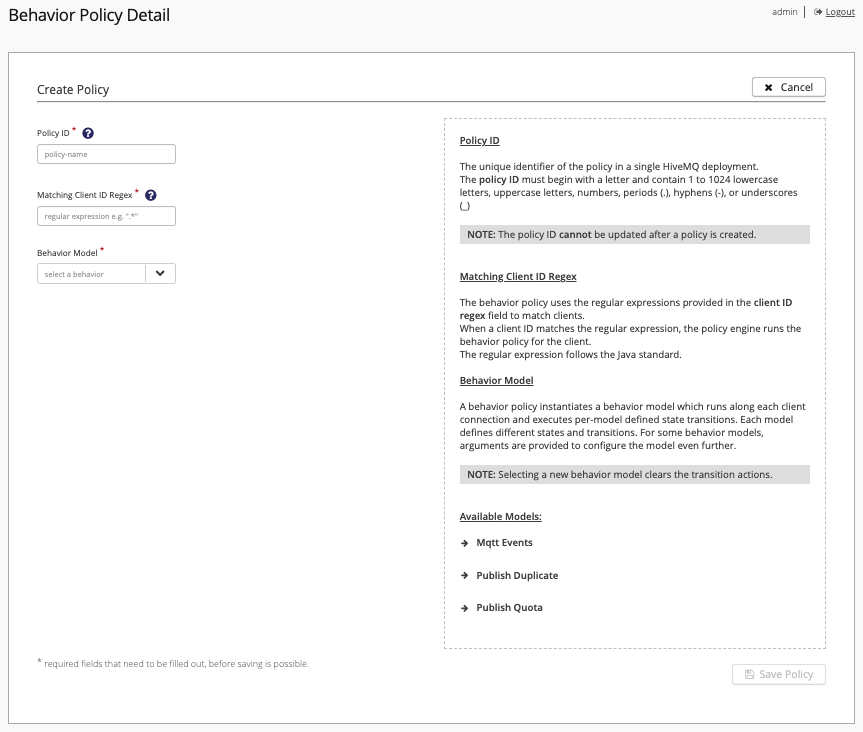
Behavior Policy Detail
The Behavior Policy Detail displays when you select the Add New Policy option on the Behavior Policies overview.
The tabs of the Behavior Policy Detail guide you through the policy creation process from defining for which clients the policy applies to defining actions that the transitions in the state of the client trigger.
All Data Hub detail pages include extensive context-sensitive help.
To open additional information for a particular item, click the ? icon.
|
For detailed configuration information and examples, see Data Hub Behavior Policies
Required fields are marked with an *.
To save the policy, all required fields must be completed.
You can save your policy at any time or switch to the Summary tab to review the policy before you save.
The Summary page of the Data Policy Detail allows you to review, edit, save, or delete your data policy at any time. To close the Summary and return to the Behavior Policies overview, select Cancel.
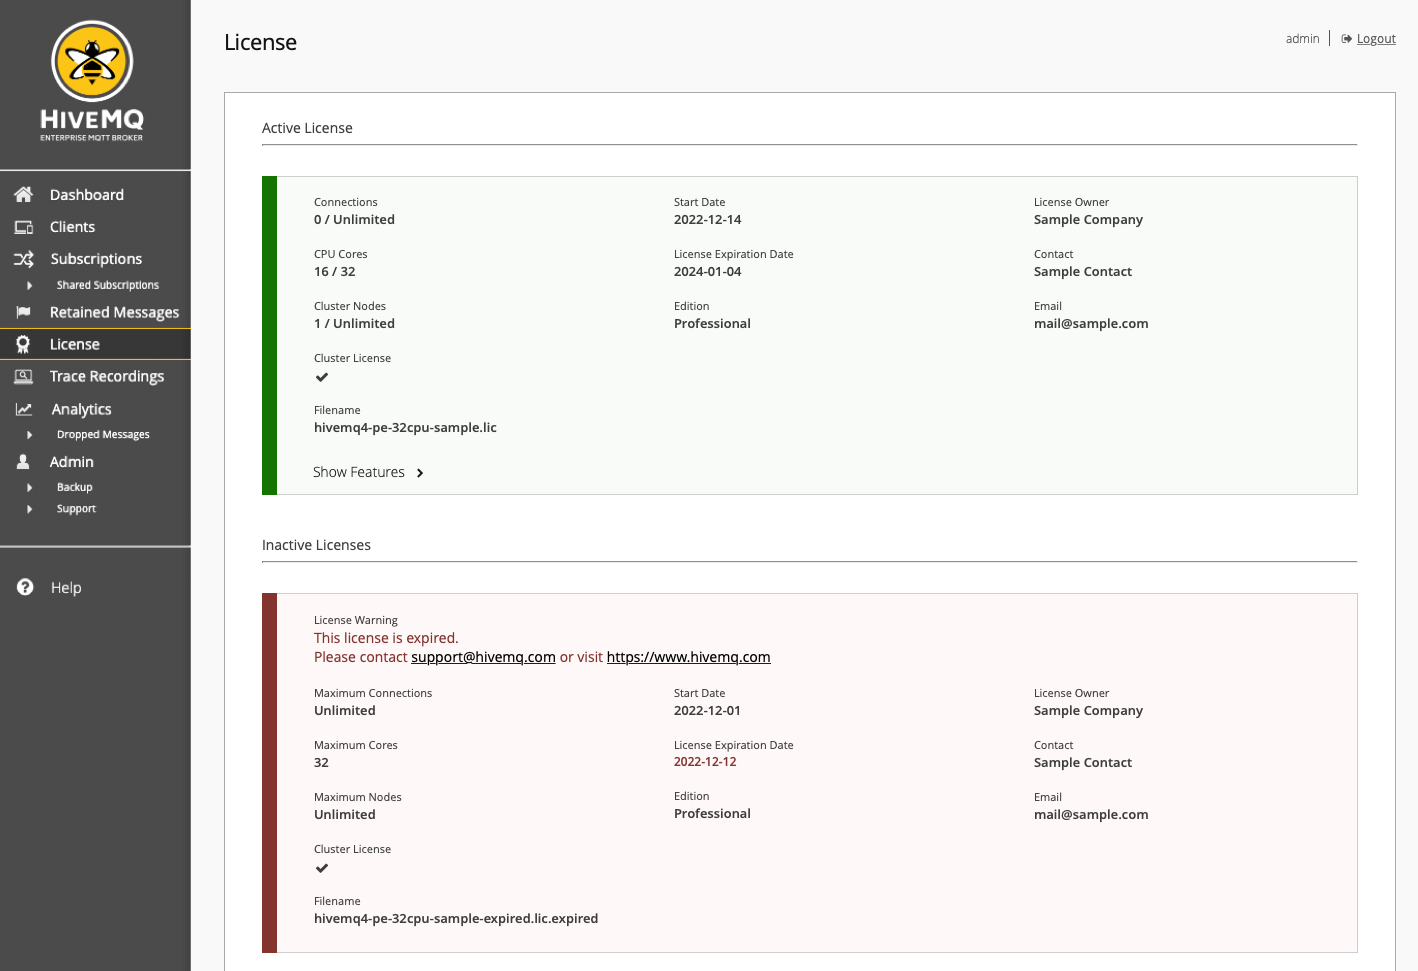
Licenses
Your HiveMQ instance can contain more than one license. The control center License view provides information on all active and inactive HiveMQ licenses that are available for the HiveMQ installation.
| Only licenses that are installed on the currently selected node are shown. |
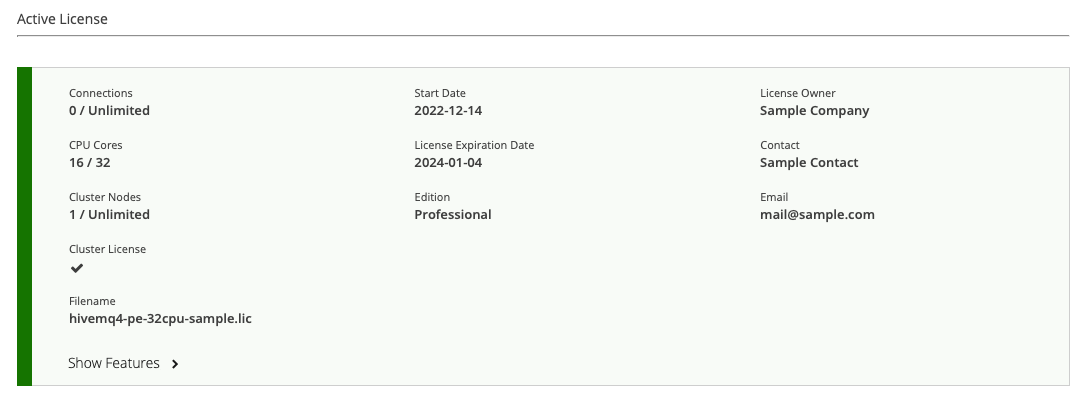
Active License
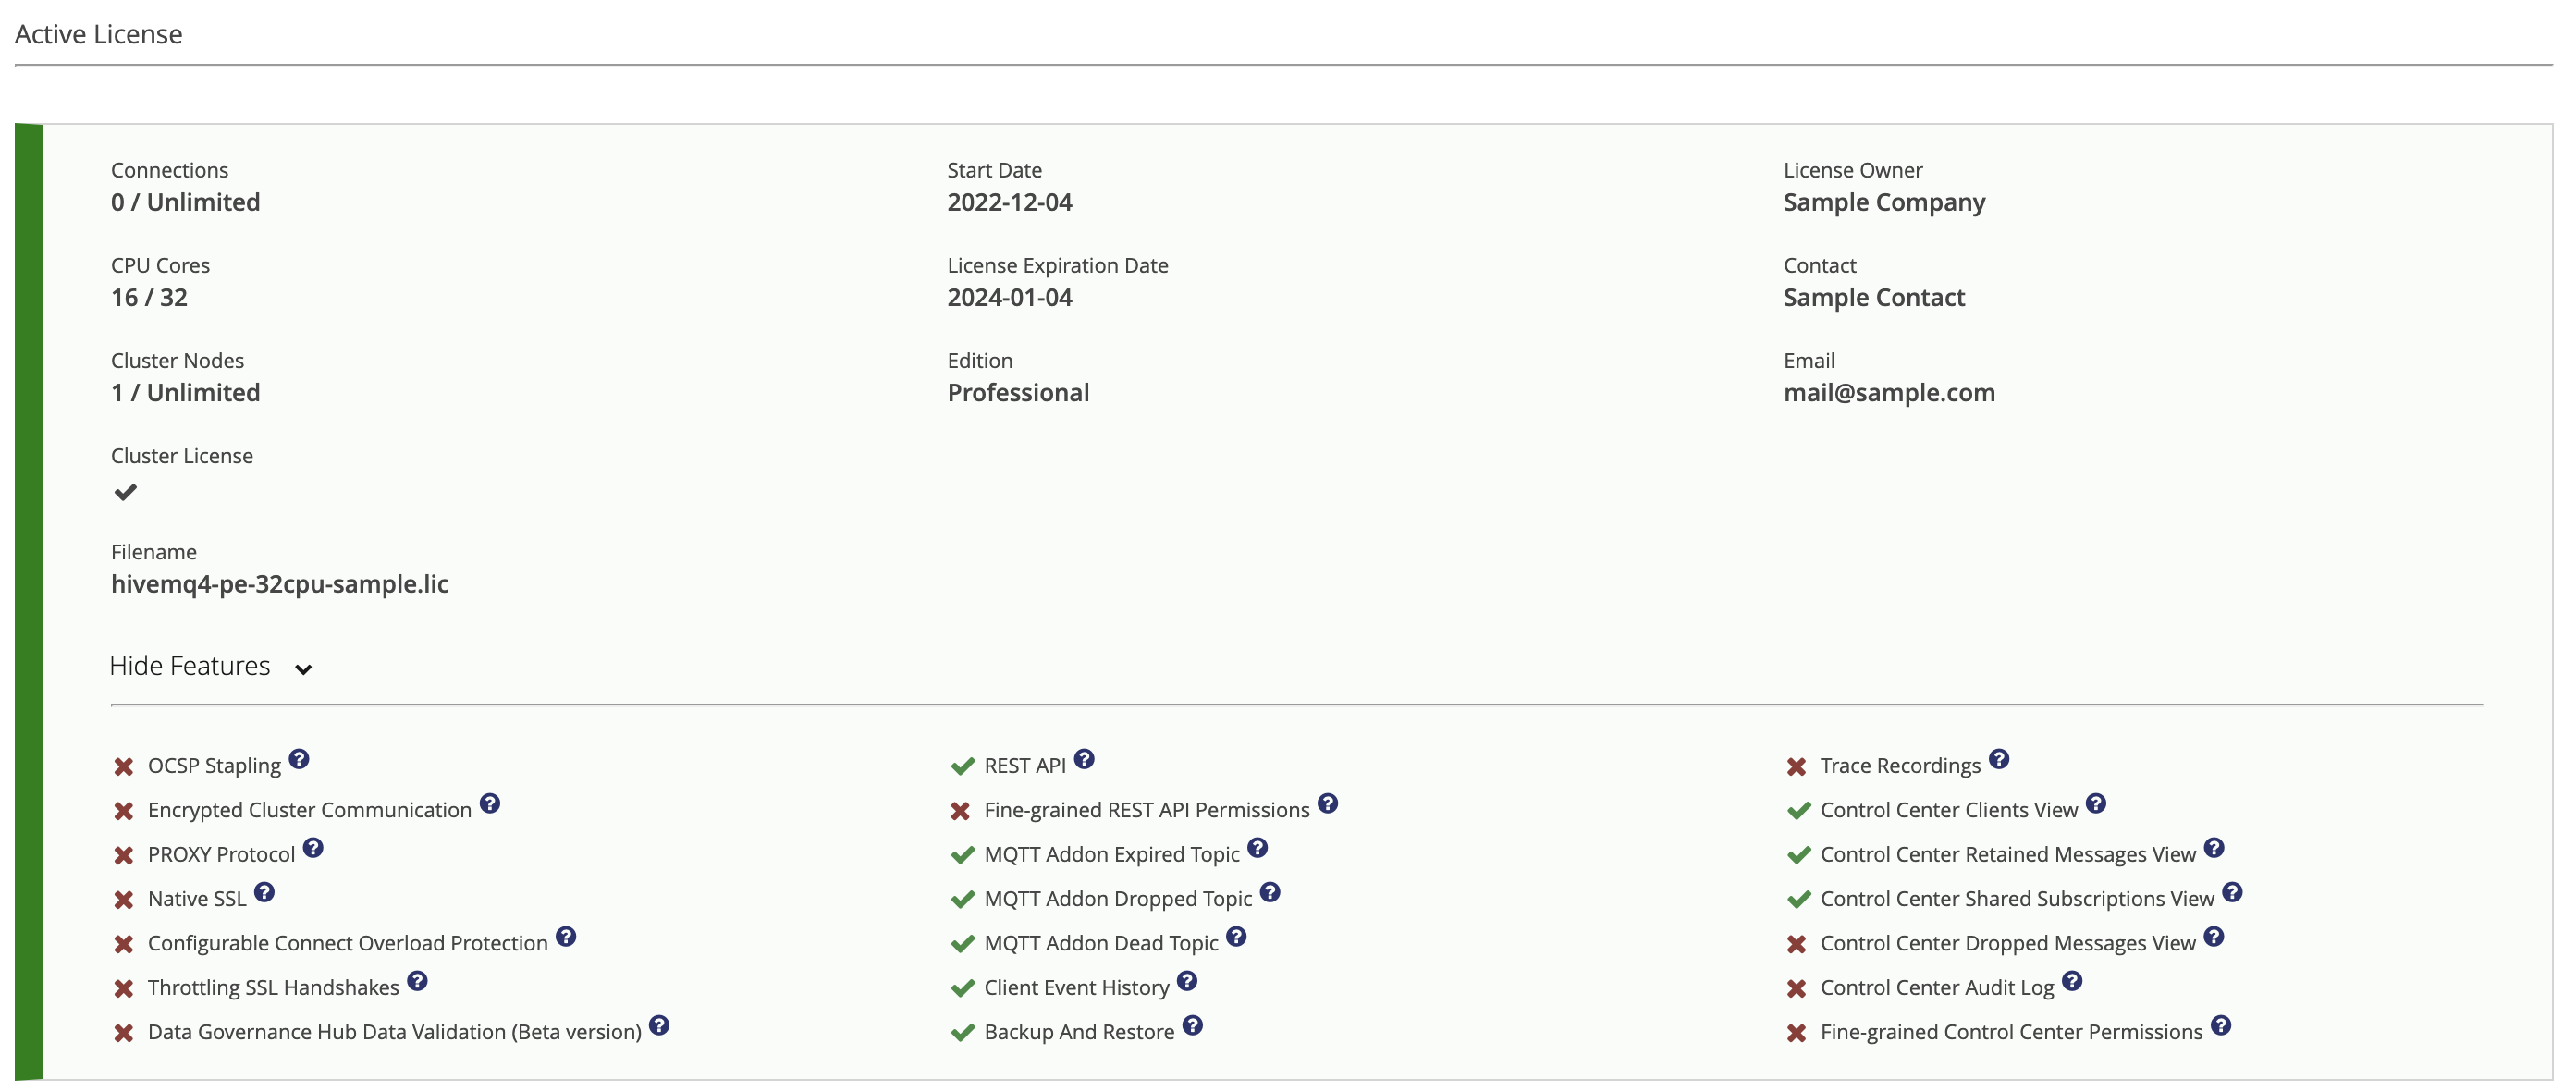
The Active License area of the control center Licenses view provides detailed information on the HiveMQ license that is currently in use. Only one license can be active at a time.
The Active License overview provides detailed information on the license that is in use.
| A brief summary of key information for the active license is also shown on the Active License Information card of the control center dashboard. |
| Item | Description |
|---|---|
Connections |
The number of concurrent client connections currently in use and the maximum number of connections the active license allows. |
CPU Cores |
The number of CPU cores currently in use and the maximum number of cores the active license supports. |
Cluster Nodes |
The number of cluster nodes currently in use and the maximum number of cluster nodes the active license supports. |
Cluster License |
Indicates whether the license enables the use of HiveMQ clusters. |
Edition |
The type of HiveMQ edition the license enables. For more information, see Editions. |
Filename |
The filename of the current license. |
Start Date |
The date on which the license was activated. |
License Expiration Date |
The expiration date of the license that is currently in use. |
License Owner |
The owner of this license. |
Contact |
Contact information for the owner of the license. |
Email address of the owner of the license. |
Show Features for Active License
To view a list of all the features the selected active license includes, expand the Show Features option.
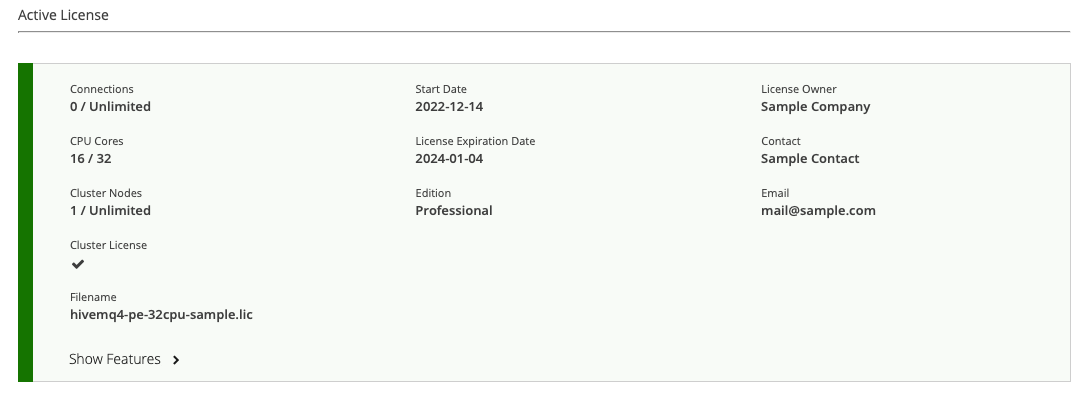
When selected, the Show Features option in the Active License area indicates all the HiveMQ features that your active HiveMQ license enables and provides links to further information.
| Feature | Description |
|---|---|
Backup and Restore |
Provides mechanisms to ensure minimum loss and quick recovery from potentially disastrous situations. For more information, see Backup and Restore. |
Client Event History |
Adds fine-grained per-client observability to the HiveMQ Control Center and provides a historical view of client events. For more information, see Client Event History. |
Configurable Connect Overload Protection |
Allows you to enable, disable, and configure your connect overload protection to control the rate of MQTT |
Control Center Audit Log |
Adds a record of all administrative actions that occur in your HiveMQ Control Center to provide a single, unified log for tracking auditing-relevant data. For more information, Audit Log. |
Control Center Clients View |
Provides information on subscriptions, connection status, TLS, and more to give you detailed insights into every client on your HiveMQ installation. For more information, see Control Center Client View. |
Control Center Dropped Messages View |
Provides the tools to track all dropped messages in your HiveMQ cluster. For more information, see Control Center Dropped Messages View. |
Control Center Retained Messages View |
Provides the tools to track and manage all the retained messages in your HiveMQ cluster including detailed information on each retained message. For more information, see Control Center Retained Message View. |
Control Center Shared Subscriptions View |
Provides a snapshot of all shared subscriptions on your HiveMQ cluster. Control Center Shared Subscriptions View. |
Data Hub Data Validation (Beta version) |
Adds the ability to validate messages based on the structure of the message content and control the flow of messages through your HiveMQ broker accordingly. |
Encrypted Cluster Communication |
Enables the use of a secure TLS connection to provide encrypted communication between the nodes of your HiveMQ cluster. For more information, see TLS. |
Fine-grained Control Center Permissions |
Adds the ability to define access to all pages of your control center and to all control center functionality. For more information, see Control Center Access Control. |
Fine-grained REST API Permissions |
Allows you to implement fine-grained access control for the HiveMQ REST API. For more information, see REST API Permissions. |
MQTT Add-on Dead Topic |
Adds a special analytical MQTT topic that you can use to automatically collect detailed information for all dead MQTT messages on your HiveMQ system. For more information, see MQTT Add-on Dead Message Topic. |
MQTT Add-on Dropped Topic |
Adds a special analytical MQTT topic that you can use to automatically collect detailed information for all dropped MQTT messages on your HiveMQ system. For more information, see MQTT Add-on Dropped Message Topic. |
MQTT Add-on Expired Topic |
Adds a special analytical MQTT topic that you can use to automatically collect detailed information for all expired MQTT messages on your HiveMQ system. For more information, see MQTT Add-on Expired Message Topic. |
Native SSL |
Enables the use of the HiveMQ native SSL implementation. For more information, see Native SSL. |
OCSP Stapling |
Allows the HiveMQ broker, rather than the client, to make status requests to the OCSP responder. For more information, see OCSP. |
PROXY Protocol |
Allows the transportation of client details such as the IP address and port over multiple proxies. For more information, see Proxy Protocol. |
REST API |
Provides an interface for applications to interact programmatically with the HiveMQ Enterprise MQTT broker. For more information, see REST API. |
SSL Handshake Throttling |
Allows you to limit the number of SSL handshake operations the HiveMQ broker allows per listener. For more information, see Restrictions. |
Trace Recordings |
Allows you to track the messages of specific clients or topics and review the information in a human-readable format. For more information, see Trace Recordings. |
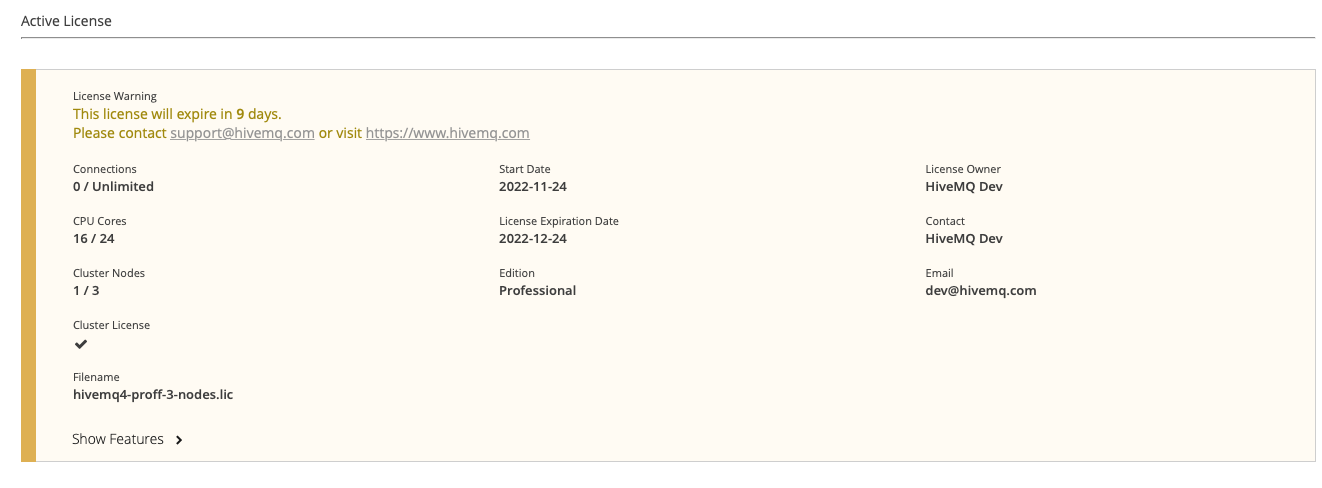
| A warning notification displays at the top of the Active License area when your license is about to expire. The default setting is 30 days before the license expiration date. This time period can be adjusted individually for each license. |
Trial license
If no license is installed in the license folder of your HiveMQ installation, HiveMQ automatically uses a free trial license. Trial licenses are limited to 25 concurrent connections:
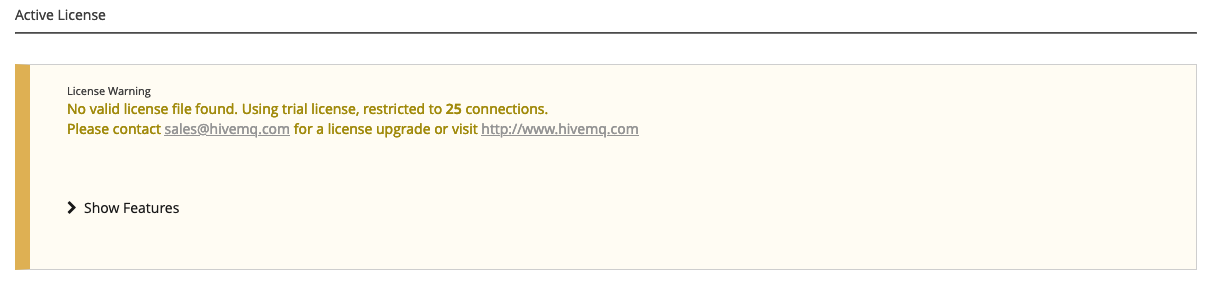
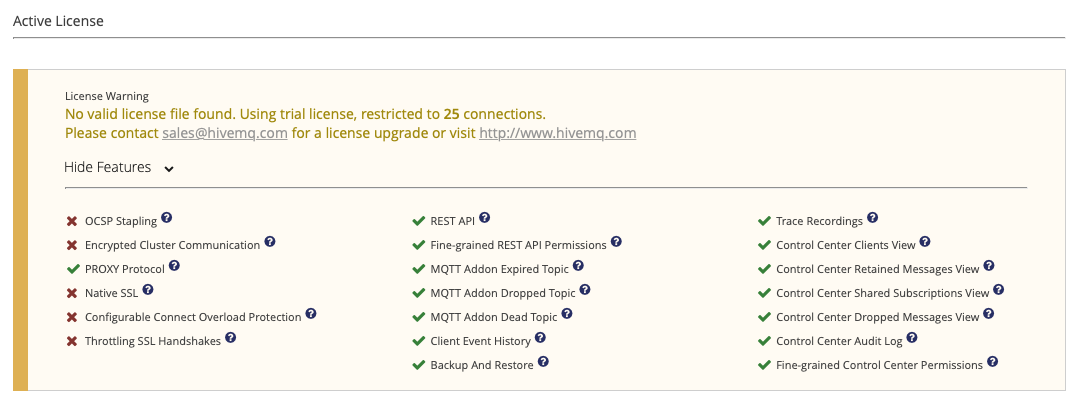
To view a list of the features the trial license includes, expand the Show Features area:
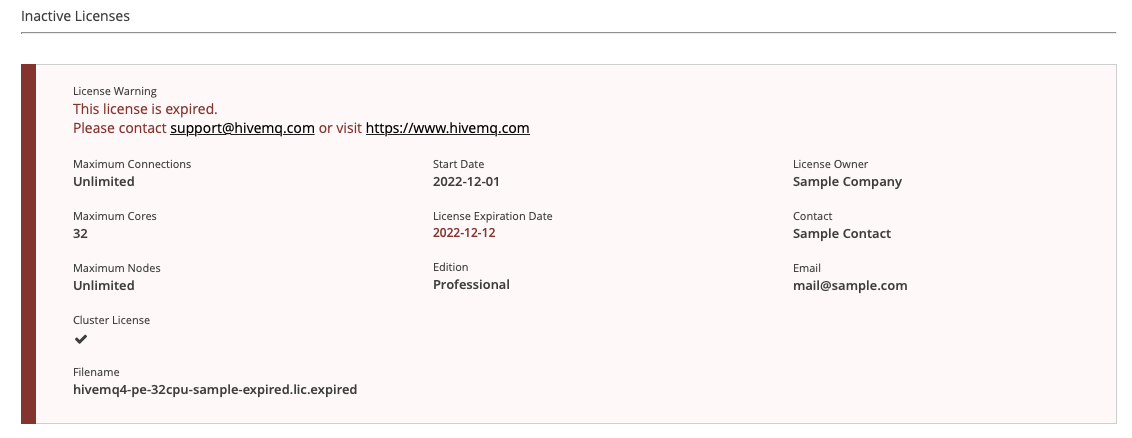
If your license expires, a trial license is used automatically. Information on the expired license appears in the Inactive Licenses area.